Weekly ecommerce tips, deals & news.
Conversion rate is the percentage of visitors who take an action you want, like making a purchase. You calculate it by dividing conversions by total visitors, then multiplying by 100. If 100 people visit and three buy, your conversion rate is 3%. It’s one of the clearest signals of how well your store turns interest into sales.
The formula is short. Divide the number of conversions by the number of visitors, then multiply by 100. Say 2,000 people visit and 40 buy. That’s a 2% conversion rate.
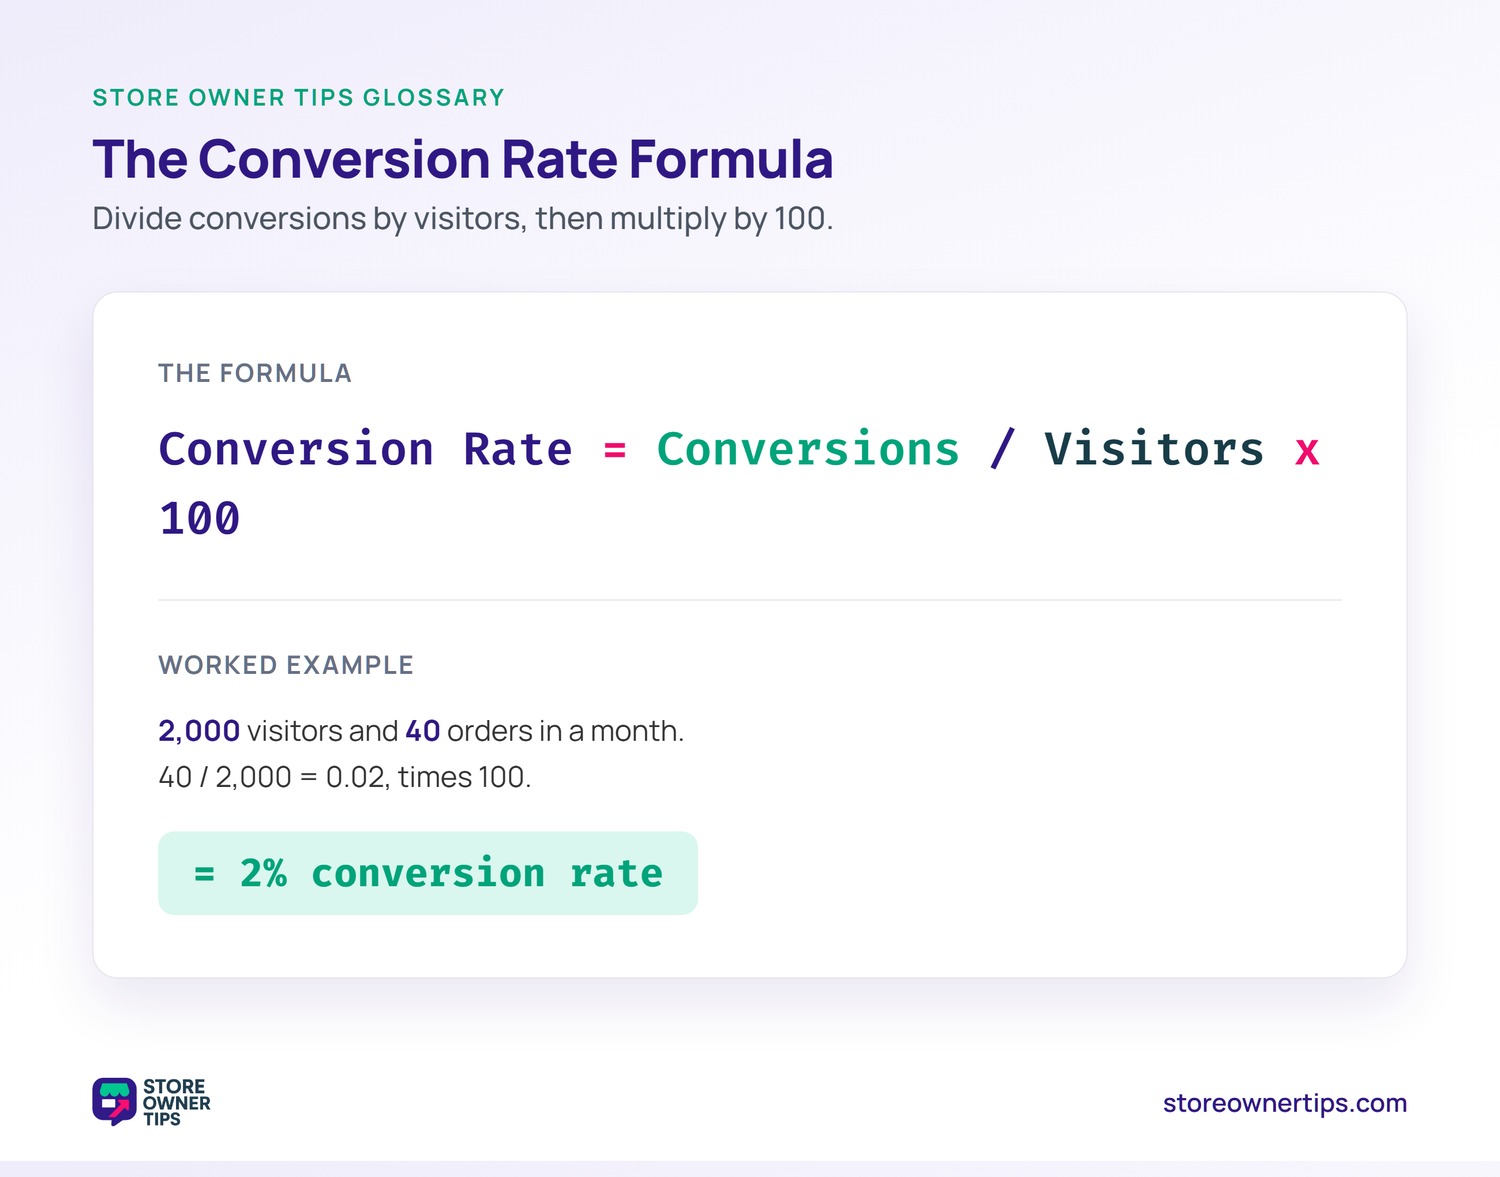
You can measure it for the whole store or one page. Many stores track product-page, add-to-cart, and checkout rates separately. Each step shows where shoppers drop off. The more specific the measure, the more useful it is.
One caution: define visitors consistently. Some tools count sessions, while others count unique users. A rate based on sessions differs from one based on people. Pick one method and stick with it so your trends stay honest.
A conversion is any action you decide matters. For most WooCommerce stores, that’s a completed order. But it can also be a newsletter signup, an account creation, or an add to cart.
Stores often split these into two types. A macro conversion is the main goal, usually a sale. A micro conversion is a smaller step toward it, like joining your list. Tracking both shows how shoppers move toward buying.
Out of the box, WooCommerce reports orders but not a true conversion rate. For that, you connect an analytics tool. WooCommerce and Shopify both work with Google Analytics, which tracks ecommerce conversions. Once linked, it records each purchase against your visitor count.
From there, set up the goals that matter. Mark the order-received page as your main conversion. You can add micro goals, like signups, alongside it. Review the report weekly so you catch shifts early.
Most ecommerce stores convert only a small share of visitors. The figure usually lands in the low single digits. It shifts a lot by industry, price, and traffic quality. Higher-priced, considered purchases tend to convert lower than cheap impulse buys.
Traffic source matters just as much. A visitor from a high-intent search converts better than a cold social click. So a blended store-wide rate can hide big differences. Segment by source to see the real picture.
So don’t chase someone else’s number. Compare your rate against your own past performance instead. A steady climb month over month matters more than hitting an average. Context beats benchmarks here.
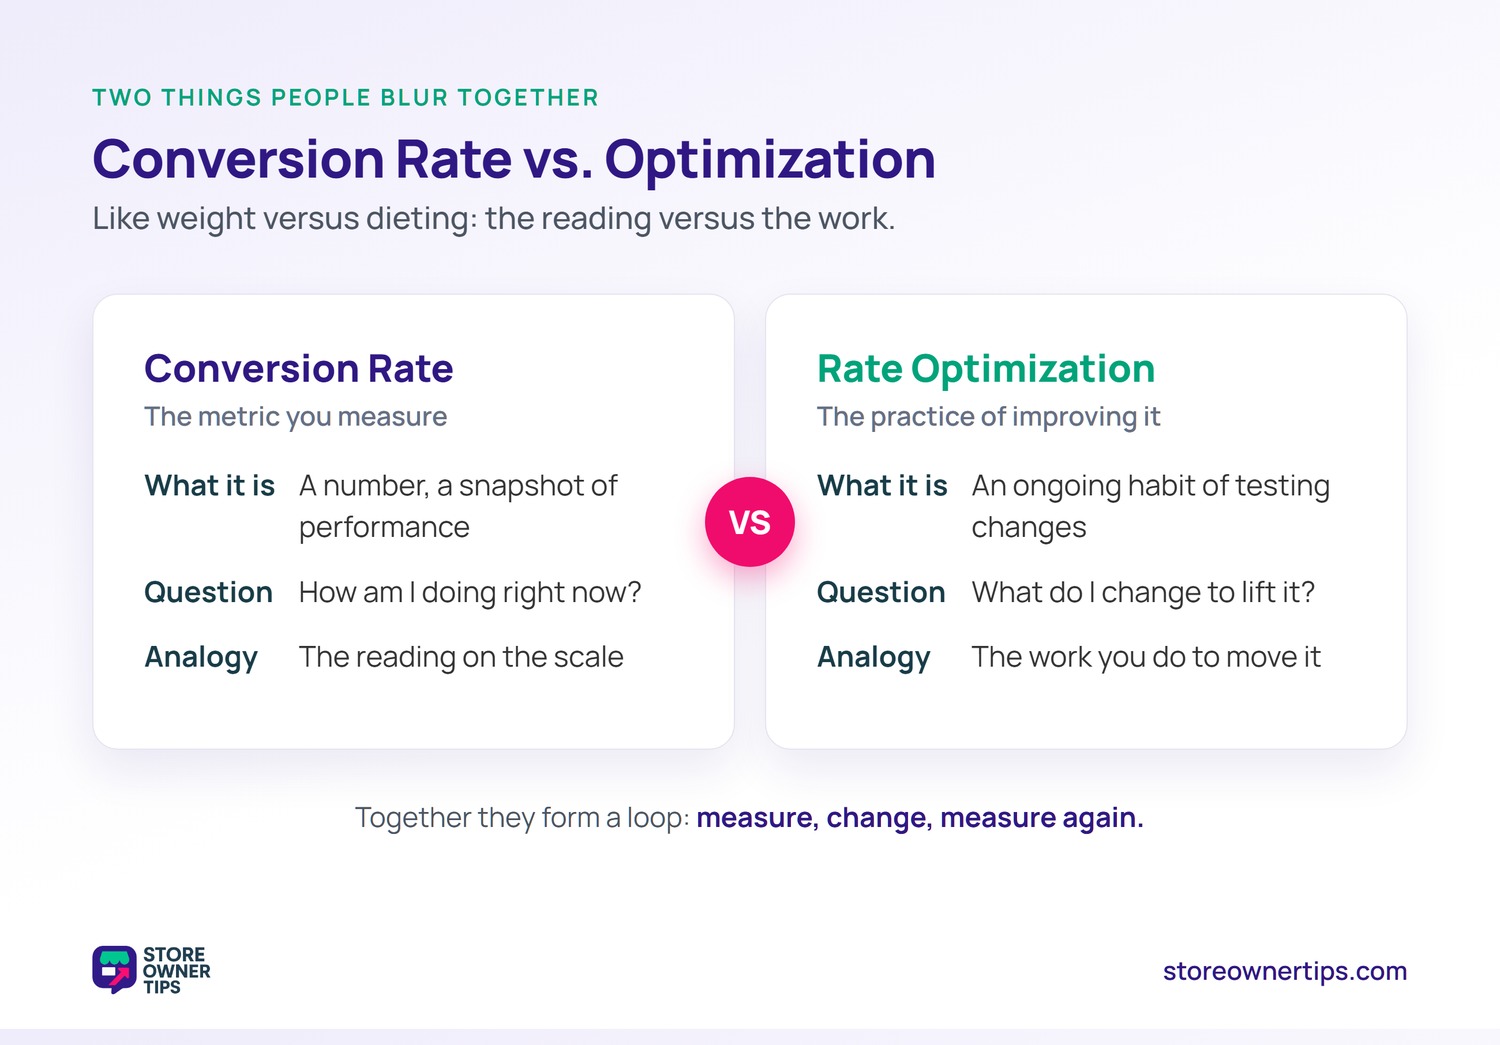
Conversion is the end of a chain, not a single moment. A visitor has to land, browse, add to cart, and check out. Each step loses some people along the way. Your overall rate hides where the worst leaks are.
That’s why funnel-level rates matter. A healthy product-page rate but a weak checkout rate points straight at checkout. Tracking each stage turns a vague problem into a fixable one. Fix the leakiest step first for the biggest gain.
Not all visitors are equal, and the rate proves it. Mobile shoppers often convert lower than desktop, even with more visits. Smaller screens and quick browsing make buying harder. A mobile-friendly checkout narrows that gap.
Channel matters too. Email and search traffic tend to convert higher than cold social or display. Those visitors already know what they want. Knowing which channels convert helps you spend where it pays off.
Time and seasonality shift the rate as well. Big sales and holidays pull in browsers who convert at lower rates. A dip during a major traffic event isn’t always a problem. Read the rate next to what is driving the traffic.
Friction is the biggest drag. The more steps and surprises between cart and confirmation, the more shoppers leave. Cart abandonment alone averages 70.22% across ecommerce. A smoother path recovers some of that lost value.
Trust signals push the other way. Showing reviews pushes purchase likelihood up. Products with five reviews see a 270% higher purchase likelihood than those with none. Clear shipping costs and easy returns help too.
Checkout design is a lever you control. Baymard found the average large store could gain a 35% increase in conversion rate through better checkout UX. Small fixes, like fewer form fields, add up. A frictionless checkout is often the fastest win.
Urgency can tip a hesitant shopper over the edge. Genuine low-stock notes or deadlines create a reason to act now. Advanced Coupons covers how to create urgency without being pushy. Keep it honest, or it backfires.
Improving the rate is mostly about removing reasons to hesitate. Speed up your pages, since slow loads quietly cost sales. Make the path to checkout short and obvious. Show the proof shoppers look for, like reviews and clear policies.
Mobile deserves special attention. More than half of store traffic often arrives on phones. If your mobile checkout is clunky, you’re leaking your biggest audience. Test the full purchase on a phone before anything else.
Then test one change at a time. Measure the before and after so you know what actually worked. Keep the wins and roll back the rest. Conversion gains come from many small, proven tweaks, not one big bet.
Conversion rate doesn’t work alone. It pairs with traffic and order size to shape revenue. Revenue is roughly visitors times conversion rate times average order value. Move any one lever and the total moves.
It also connects to acquisition cost. A higher conversion rate means each paid visitor is more likely to buy. That lowers your effective customer acquisition cost. So conversion gains ripple across the whole funnel.
This is why conversion rate is a profit lever, not a vanity stat. Lifting it can grow revenue from the same ad budget. Few other metrics give that kind of leverage.
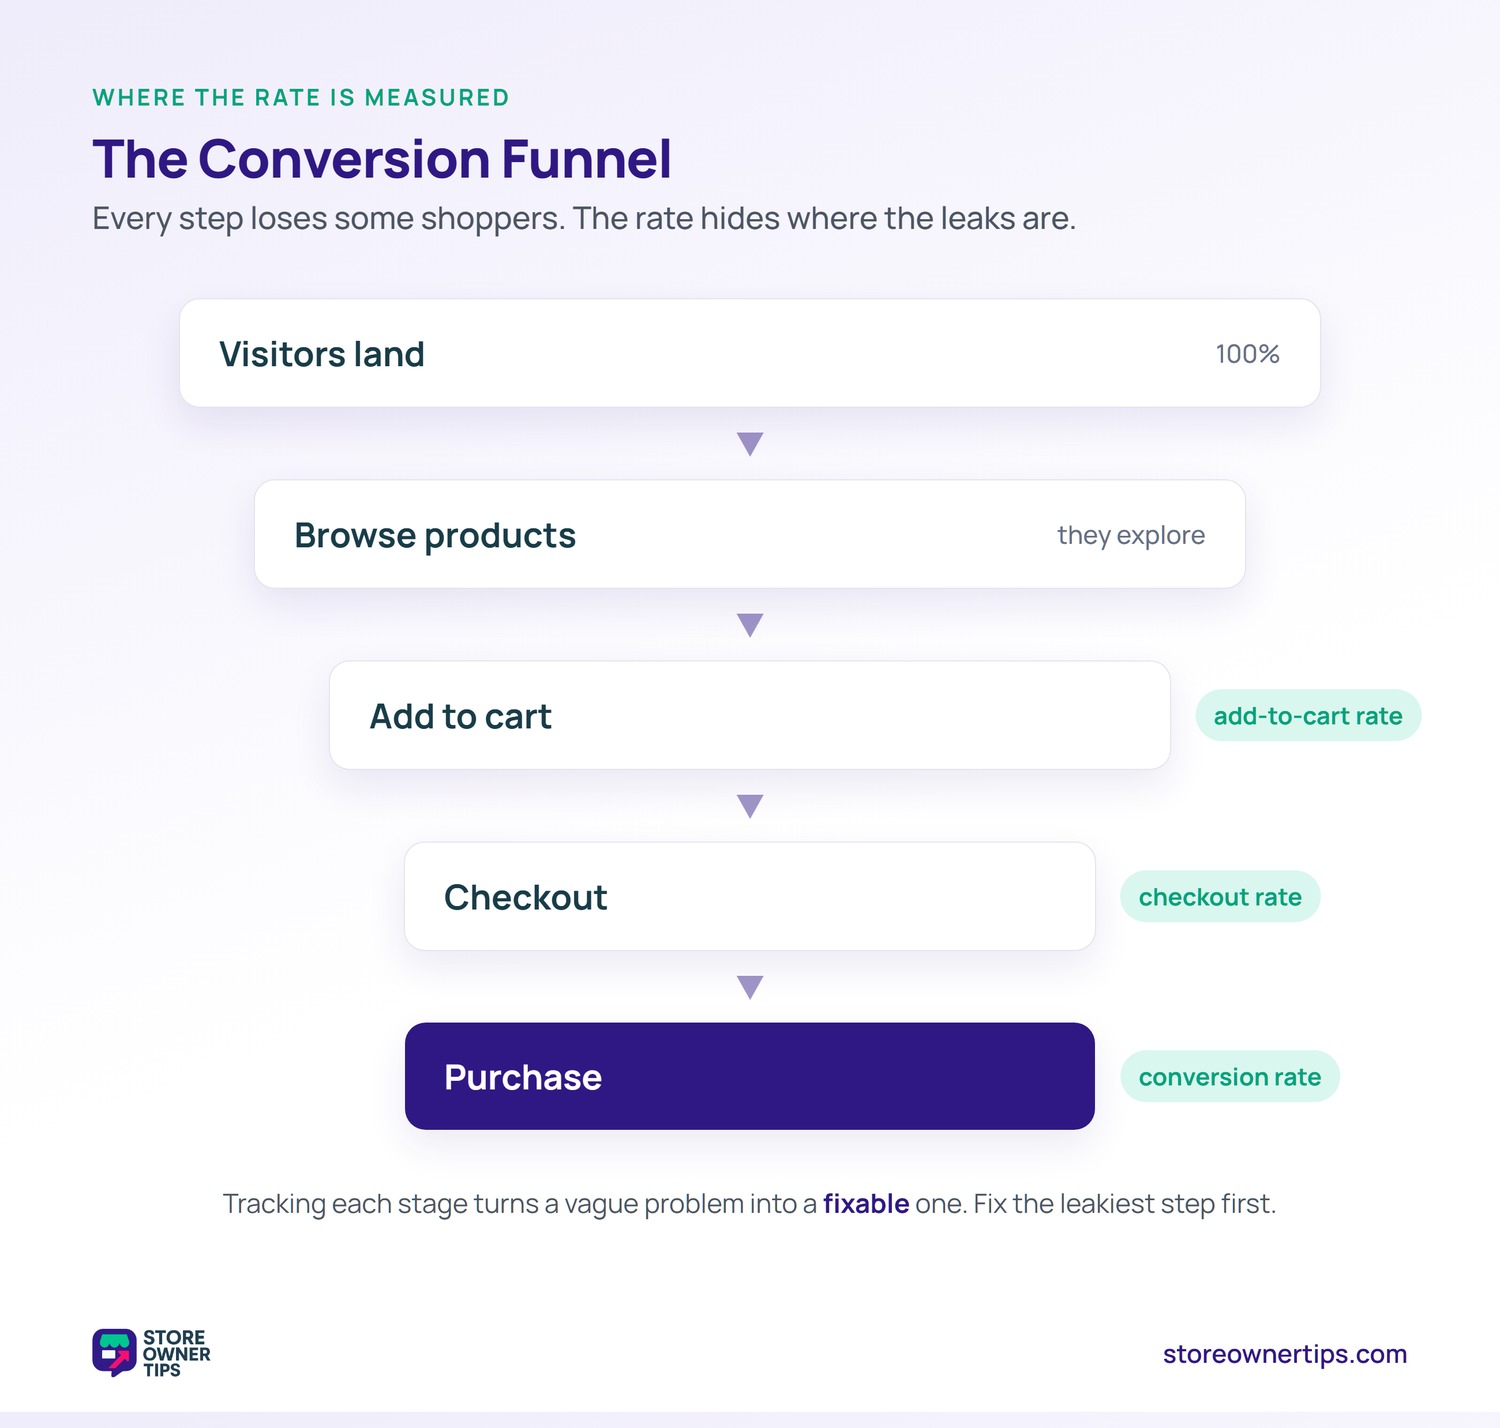
Imagine an online store selling desk lamps. It gets 10,000 visitors a month and 200 orders. That’s a 2% conversion rate. The owner wants more sales without buying more traffic.
She starts with checkout. She trims the form, adds guest checkout, and shows shipping costs early. These are the kinds of fixes tied to real conversion gains. The rate creeps from 2% to 2.5%.
That half-point looks tiny. But it means 250 orders instead of 200. That’s 50 extra orders a month from the same traffic. Over a year, the math turns serious.
Then she adds product reviews. Trust climbs, and hesitant shoppers convert more often. The same traffic now produces even more orders. None of it required a bigger ad budget.
The owner keeps a simple log. Each change gets a date and a before-and-after rate. Patterns emerge over a few months. The store improves because the work is measured, not guessed.
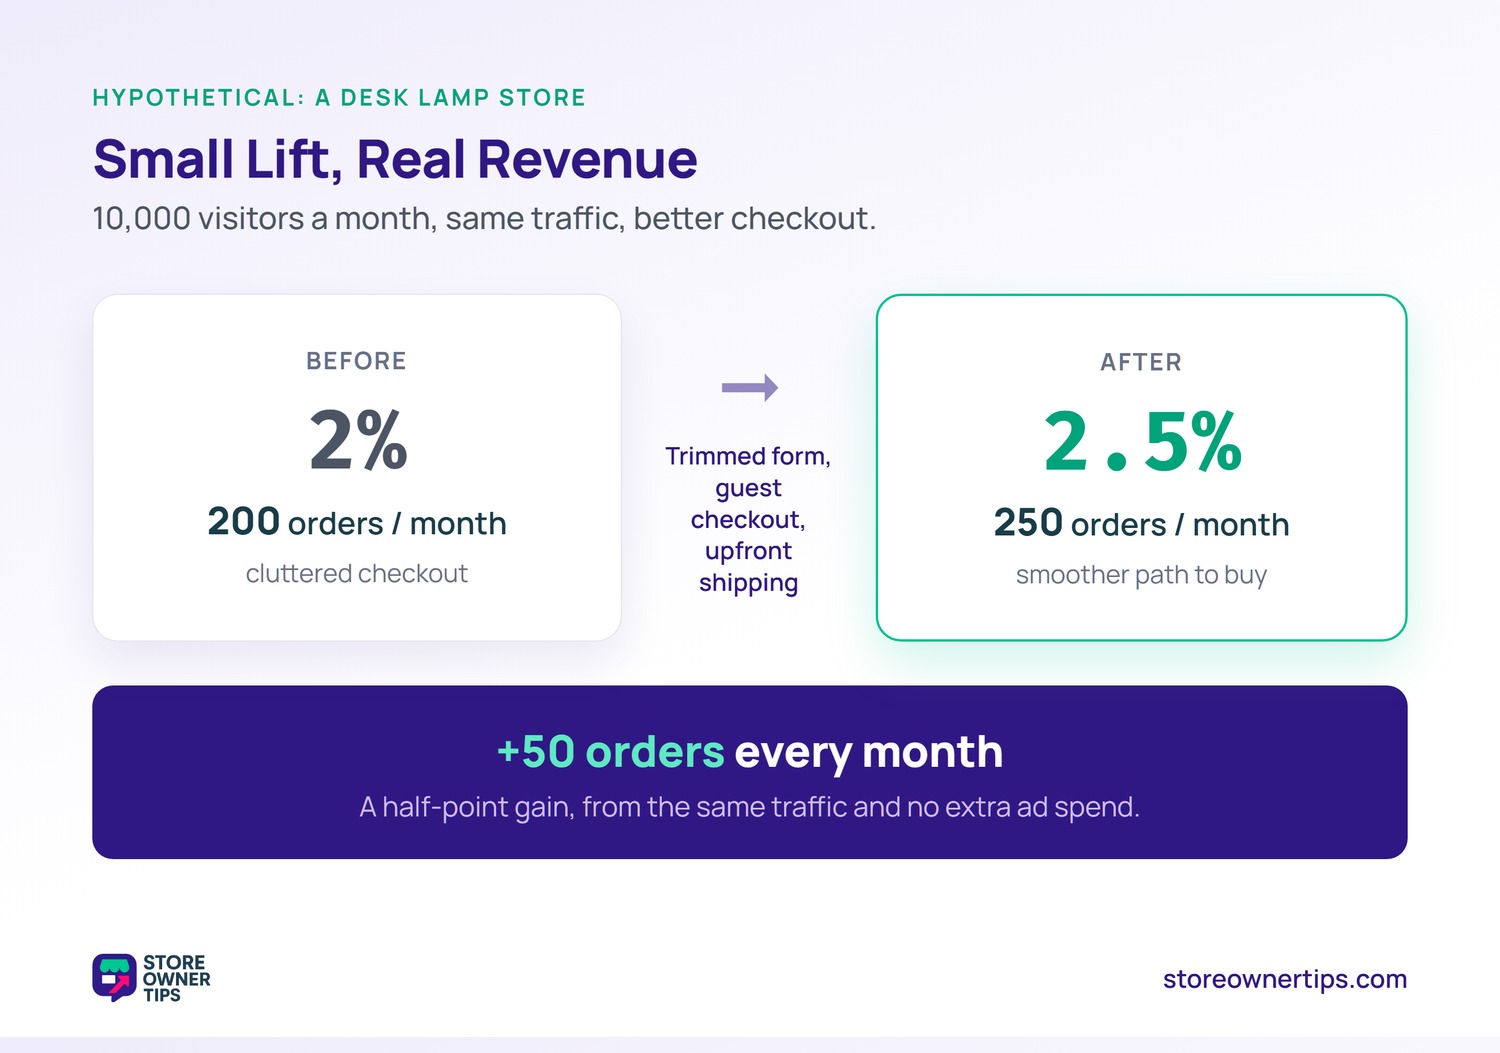
These two get blurred, but they aren’t the same. Conversion rate is the metric, the number you measure. Conversion rate optimization is the ongoing practice of improving that number.
Think of it like weight versus dieting. The rate is the reading on the scale. Optimization is the work you do to move it. You need the metric to know if the work is paying off.
One is a snapshot, the other is a habit. You check the rate to spot a problem. Then optimization gives you the steps to fix it. Together they form a loop of measure, change, and measure again.
There’s no single magic number. Most stores land in the low single digits, and it varies by industry and price. A better question is whether your rate is improving over time. Compare against your own history, not a generic benchmark.
Divide your conversions by your total visitors, then multiply by 100. If 500 people visit and 15 buy, that’s a 3% conversion rate. You can run this for the whole store or a single page. Most analytics tools calculate it for you.
Usually it’s friction or mismatched traffic. A clunky checkout, surprise shipping costs, or slow pages all push shoppers away. Also check your tracking, since a broken tag can make a healthy rate look terrible. Start by fixing checkout and matching ads to intent.
Conversion rate tells you how well your store turns visits into action. It rewards small, steady improvements far more than chasing more traffic. Watch it closely, test against it, and treat every point of lift as compounding revenue.
Copyright © StoreOwnerTips.com. All Rights Reserved.
