Weekly ecommerce tips, deals & news.

Picture searching “how many stores use WooCommerce” and getting three different answers from three pages published the same month. That’s normal for WooCommerce statistics, because the number depends on who counted, when and how.
So this page publishes fewer WooCommerce statistics, and each one is traceable. Every figure names the page that first reported it and shows when we last checked it. Each section ends with one line on what the numbers mean for your store. Where two sources disagree, we say so instead of picking the bigger number.
WooCommerce powers more than 4 million online stores, according to WooCommerce, citing Store Leads. Meanwhile, Baymard Institute puts the average documented cart abandonment rate at 70.22%.
I’ve found the most useful figure is usually the one with the clearest source, not the biggest one. That’s the standard every number below had to meet.
Jump to:
These are the ten strongest WooCommerce statistics on this page. We checked each one against its primary source on November 2, 2026, and each has its own section below.
| Statistic | Figure | Primary source | Last verified |
|---|---|---|---|
| Online stores built with WooCommerce | 4M+ | WooCommerce, citing Store Leads | Nov 2, 2026 |
| Share of the top 1M ecommerce sites on WooCommerce | 31% | WooCommerce, citing Store Leads | Nov 2, 2026 |
| Share of the internet running WordPress | 43.5% | WooCommerce | Nov 2, 2026 |
| US retail ecommerce sales, Q2 2026 (seasonally adjusted) | $340.2 billion | US Census Bureau | Nov 2, 2026 |
| Ecommerce share of US retail sales, Q2 2026 | 17.1% | US Census Bureau | Nov 2, 2026 |
| Internet share of UK retail sales, September 2026 | 28.3% | Office for National Statistics | Nov 2, 2026 |
| EU internet users who bought online, 2025 | 78% | Eurostat | Nov 2, 2026 |
| Average documented cart abandonment rate | 70.22% | Baymard Institute | Nov 2, 2026 |
| Abandoners who left over extra costs (shipping, tax, fees) | 40% | Baymard Institute | Nov 2, 2026 |
| US consumers willing to let AI make purchase decisions | 11% at most | Gartner | Nov 2, 2026 |

Last verified: November 2, 2026.
WooCommerce runs more than 4 million online stores, according to WooCommerce’s enterprise page. That page credits Store Leads, which counts stores using the WooCommerce cart or checkout. The same page puts WooCommerce on 31% of the top 1 million ecommerce sites, again citing Store Leads.
The plugin’s own WordPress.org listing shows a bigger number: 7+ million active installations as of November 2, 2026. However, that counts sites with the plugin switched on, not stores that are selling. So it measures something different from the Store Leads figure.
WooCommerce runs on WordPress, and that base is large. According to WooCommerce’s product page, WordPress powers more than 82 million sites, or 43.5% of the internet.
WooCommerce’s enterprise page gives a rounder 43% for the same figure and credits W3Techs. We use 43.5% in our table because it’s the more specific of the two. Either way, both numbers come from WooCommerce’s own pages, not from a blog quoting them.
For history, WooCommerce’s about page says the plugin passed seven million downloads in 2014. That’s a download count from more than a decade ago, not a live-store count. As a result, it doesn’t line up with the 4 million figure.
You’ll see WooCommerce statistics on store counts that start at about 4 million and run well above it. Most of that gap comes from three differences in method:
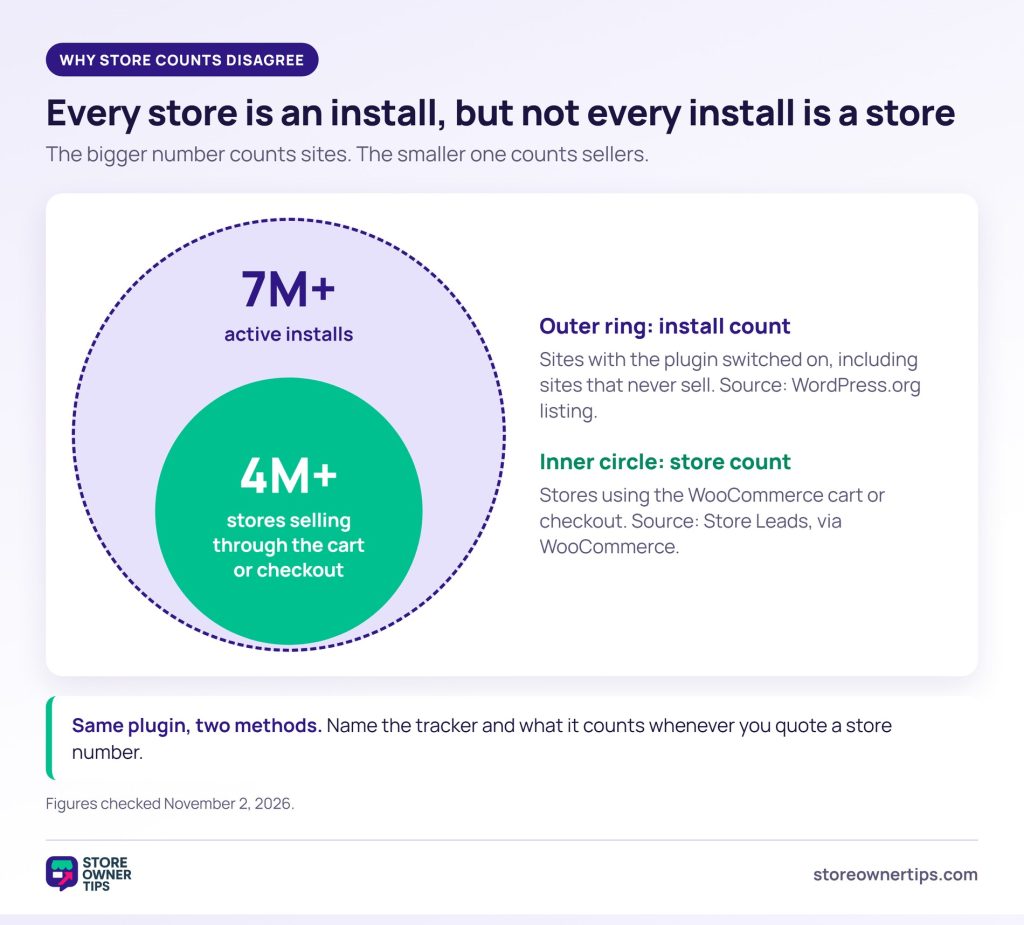
When you quote a store count, name the tracker and its method in the same sentence. “4M+ stores using the WooCommerce cart or checkout (Store Leads)” can be checked. A store count with no source can’t.
What this means for your store: a large install base means plenty of developers, hosts and add-ons to choose from. So check the WooCommerce plugins most stores use before paying for custom work.
Last verified: November 2, 2026.
Online sales are a large, steady share of retail on both sides of the Atlantic. The UK share is higher than the US share. Here are the latest official figures from each government statistics office.
US retail ecommerce sales reached $340.2 billion in Q2 2026, according to the US Census Bureau. That figure is seasonally adjusted but not adjusted for price changes. It’s up 3.8% from Q1 2026 and up 12.2% from Q2 2025.
Total US retail sales were $1,986.5 billion in the same quarter. So ecommerce accounted for 17.1% of all retail. The Census Bureau will publish revised estimates with its Q3 2026 release on November 19, 2026. We’ll update this section then.
Internet sales made up 28.3% of total UK retail sales in September 2026, according to the Office for National Statistics. That’s up from 27.3% in August. So far in 2026, the monthly figure has moved between 27.3% and 28.7%.
Because it’s a monthly series, it moves. The ONS next updates it on November 20, 2026, and we re-check the latest month each time.
78% of EU internet users bought or ordered goods or services online in 2025, according to Eurostat. That’s up from 62% in 2015. Eurostat also reports that 95% of people aged 16 to 74 used the internet in the previous 12 months.
| Market | Latest figure | Period | Source |
|---|---|---|---|
| United States | Ecommerce = 17.1% of retail sales ($340.2B) | Q2 2026 | US Census Bureau |
| United Kingdom | Internet sales = 28.3% of retail sales | September 2026 | ONS (J4MC) |
| European Union | 78% of internet users bought online | 2025 | Eurostat |
These three figures measure different things. The US and UK numbers are a share of retail sales, while the EU number is a share of people. So they work best side by side in a table, not plotted on one chart as the same metric.
What this means for your store: if UK or EU shoppers already find you, the demand is there. From there, selling internationally on WooCommerce is mostly a currency, tax and shipping setup job.
Last verified: November 2, 2026.
The average documented online cart abandonment rate is 70.22%, according to Baymard Institute. Baymard calculates it as the average of 50 separate studies. Its list page was last updated on September 22, 2025.
Baymard’s checkout research page still shows an older 70.19% average. We use the list page’s 70.22% because it’s the newer figure, and we don’t mix the two.
In Baymard’s survey, 42% of US online shoppers had abandoned a cart while “just browsing” or not ready to buy. Those shoppers are hard to win back. The table below sets that group aside and shows why the rest abandoned during checkout.
| Reason for abandoning during checkout | Share of abandoners |
|---|---|
| Extra costs too high (shipping, tax, fees) | 40% |
| Delivery was too slow | 20% |
| Didn’t trust the site with card information | 19% |
| Site wanted them to create an account | 18% |
| Checkout too long or complicated | 17% |
| Website had errors or crashed | 17% |
| Returns policy wasn’t satisfactory | 13% |
| Couldn’t see or calculate total cost up front | 12% |
| Credit card was declined | 10% |
| Not enough payment methods | 9% |
Read the denominator carefully. “40%” means 40% of US shoppers who abandoned a checkout for a reason other than browsing. It doesn’t mean 40% of all your visitors. Shoppers could pick more than one reason, so the column adds up to more than 100%.
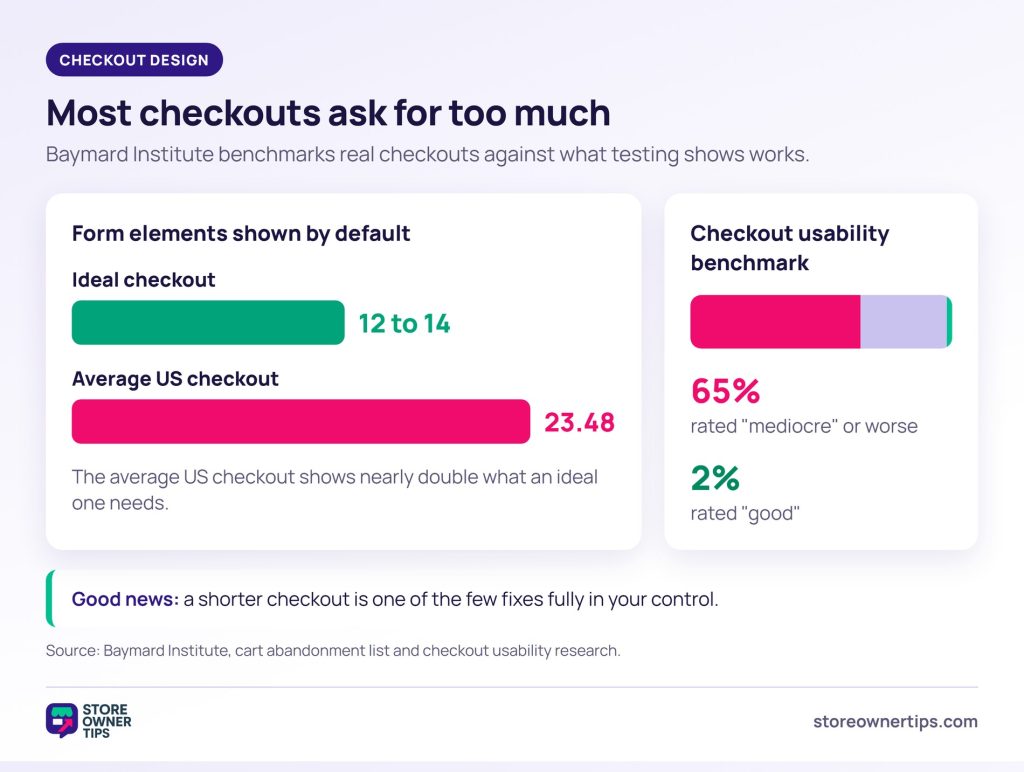
In Baymard’s latest checkout usability benchmark, 65% of sites rated “mediocre” or worse. Only 2% rated “good.”
Baymard’s testing also found the average large-scale ecommerce site could see a 35% higher conversion rate with better checkout design. That figure comes from large sites. Treat it as a sign of how much checkout design matters, not as a forecast for a small store.
Length is part of the problem. Baymard’s testing shows an ideal checkout can be as short as 12 to 14 form elements. Yet the average US checkout shows 23.48 form elements by default.
🔍️ What we’ve seen: Store owners often quote “70% of carts are abandoned” as if it were their own rate. That figure is an average across 50 studies of other sites. Your own rate is already in your analytics, so it’s worth checking before deciding you have a problem.
What this means for your store: extra costs top the list, so show shipping early. Then work through these fixes for checkout abandonment before you discount anything.
Last verified: November 2, 2026.
Credit and debit cards are still how most US consumers pay. The Federal Reserve’s 2026 Findings from the Diary of Consumer Payment Choice tracks this every year. In 2025, the average consumer made 47 payments a month, down from 48 in 2024. Cards led, and cash came third.
The Fed’s 2025 data breaks down like this:
Preferences are shifting toward credit. For in-person purchases, 38% of consumers named credit cards as their preferred method in 2025. That’s two points behind debit cards at 40%.
Payments also show up in the abandonment data above. In Baymard’s survey, 10% of checkout abandoners left because their card was declined. Another 9% left because there weren’t enough payment methods. Those are the same respondents as the earlier table, so they aren’t extra to it.
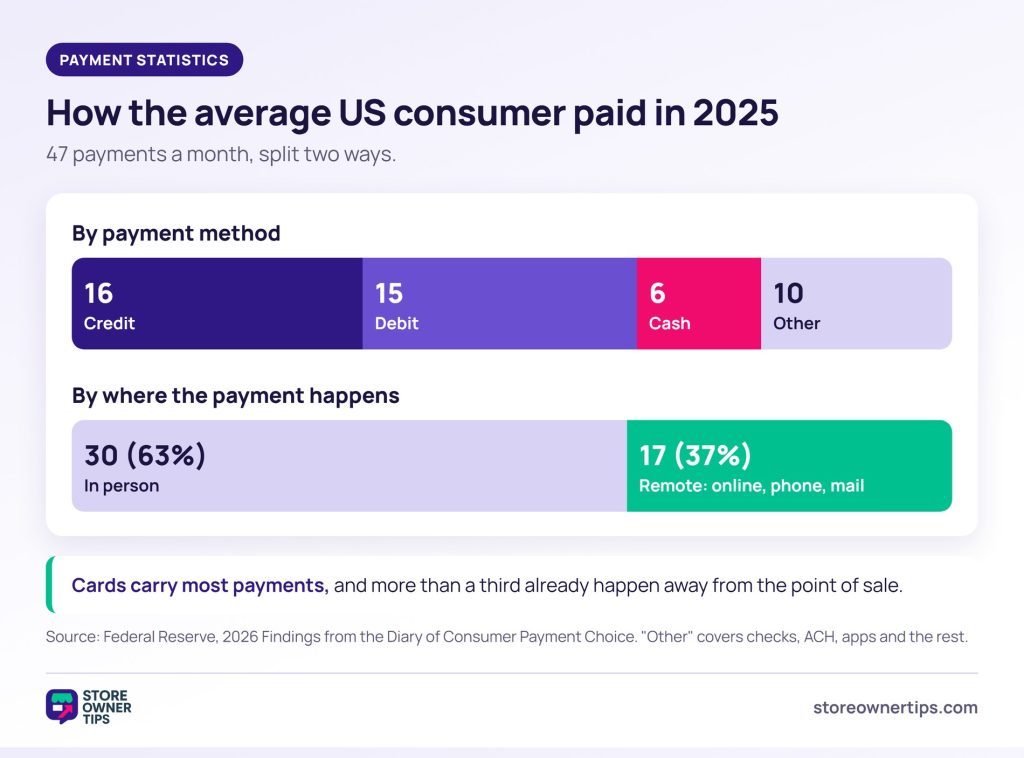
What this means for your store: cards carry most payments, but a missing option still costs sales. So compare WooCommerce payment gateways on which payment methods each one adds.
Last verified: November 2, 2026.
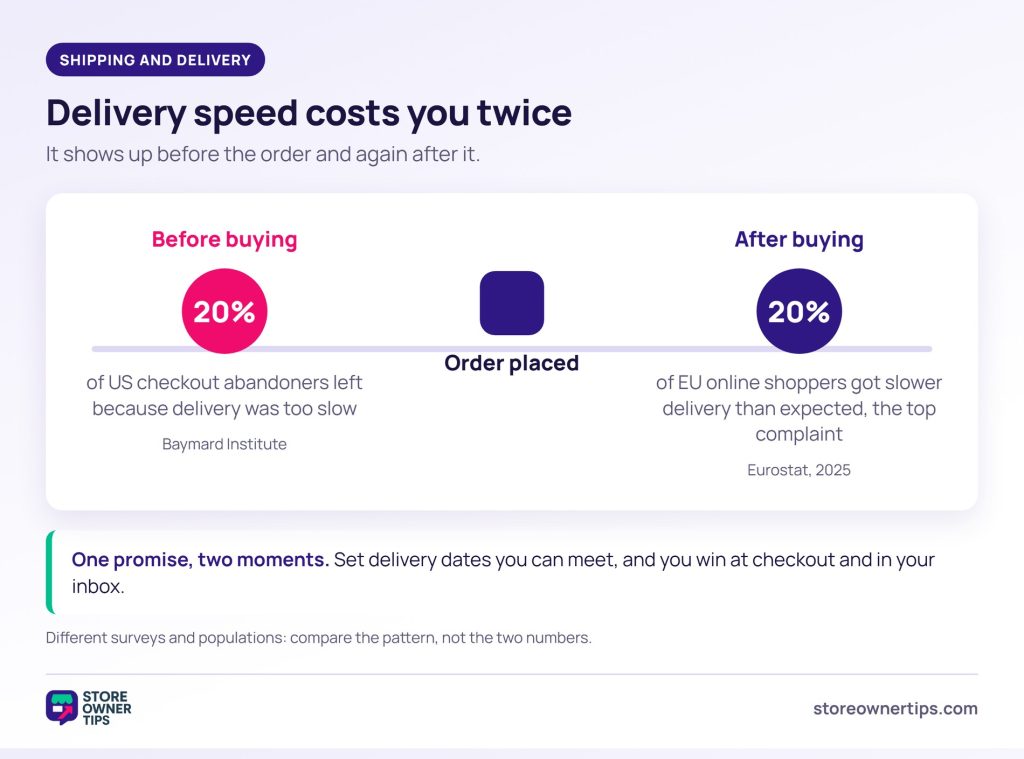
Shipping cost and delivery speed are two of the biggest reasons shoppers leave. In Baymard’s data, 40% of checkout abandoners cited extra costs such as shipping, tax and fees. Another 20% said delivery was too slow (see the full reasons table). Many stores answer this with free shipping over a set order amount.
The EU data points the same way after the order is placed. According to Eurostat, 63% of EU online shoppers reported no problem with their purchases in 2025. Among the problems people did report:
So delivery speed shows up twice: as a reason to abandon before buying, and as the top complaint after. A delivery date you can’t meet costs you once at checkout and again in your support inbox.
What this means for your store: shipping cost is the one number every shopper sees before paying. So set shipping rates that cover what you pay without surprising anyone at the last step.
Last verified: November 2, 2026.
Businesses use AI widely, but shoppers still want to make the final call themselves. Nearly nine in ten respondents to McKinsey’s 2026 AI survey report regular AI use in at least one function. Also, 44% say AI is now scaling across their enterprise, up from 38% a year earlier.
AI agents are spreading unevenly. Among large organizations with over $1 billion in annual revenue, 40% report scaling AI agents. That’s up from 27% a year earlier. At smaller organizations, the share stayed essentially flat at 22%.
Shoppers are more cautious. In a Gartner survey of 322 US consumers in January 2026, at most 11% would let AI make purchase decisions. That ceiling held even in lower-stakes categories such as personal care and household supplies. More were open to AI narrowing their choices: 31% for household supplies and 28% for personal electronics.
The same Gartner release, dated May 27, 2026, reports a separate survey of 846 US consumers. Among those who used AI while shopping, 54% said they had to double-check all the information it gave.
Customer service follows a similar pattern. In a Gartner survey of 3,566 customers, 50% said interactions are easier when companies use generative AI. However, 87% said companies using it must offer a way to reach a human agent. Gartner released those findings on August 4, 2026.
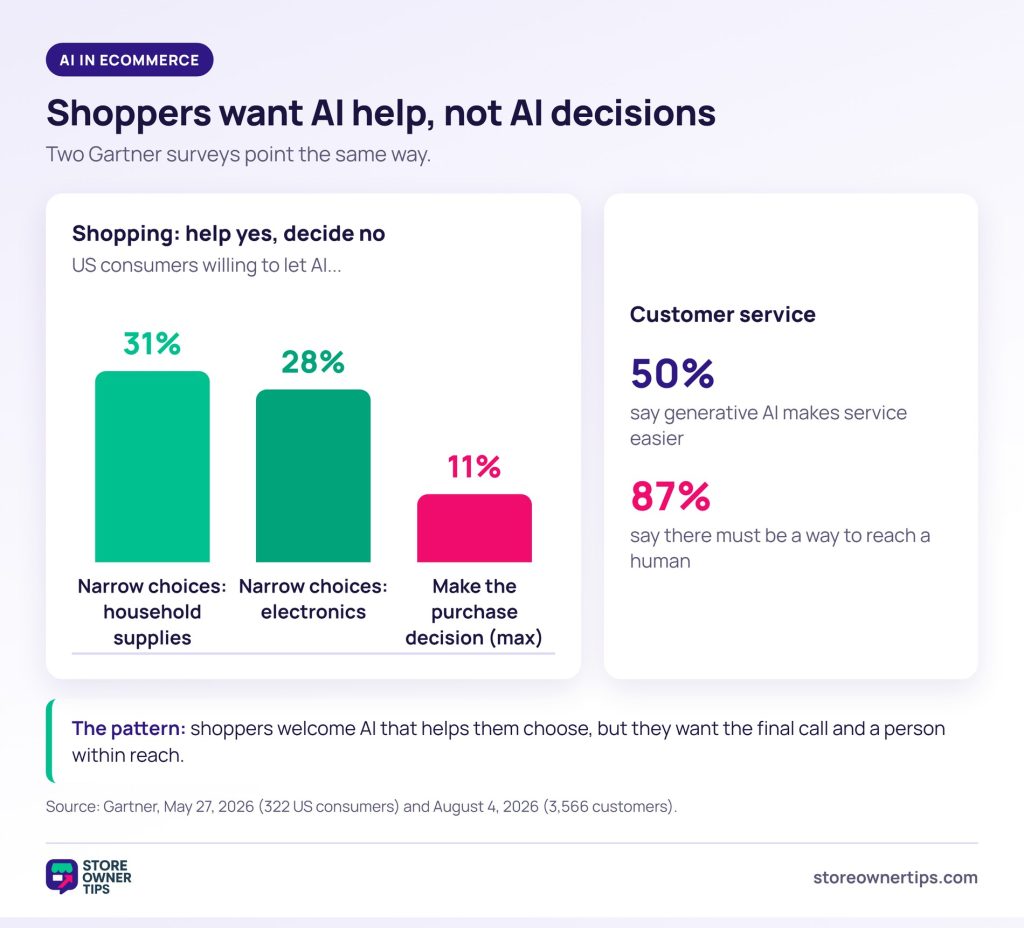
What this means for your store: let AI answer questions and narrow choices, but keep a route to a person. Our guide to AI tools for WooCommerce compares options built for that job. Our sister site StoreAgent also tracks ecommerce customer service statistics.
The most useful WooCommerce statistics are your own. Industry averages tell you what’s normal across many stores. Your own numbers show where your store is losing sales.
WooCommerce Analytics, built into WooCommerce, covers what happens after a shopper buys. You’ll find it under Analytics in your WordPress dashboard. Its reports include revenue, orders, products, categories, coupons and customers. Use it to answer questions like “which products bring in the most revenue?” or “did last month’s coupon lift orders?“
However, it doesn’t show the steps before the order, such as product views, add-to-carts and checkout starts. For those funnel steps, you need Google Analytics 4 with ecommerce events turned on. That’s also where you’ll find your own cart abandonment rate, instead of borrowing Baymard’s average.
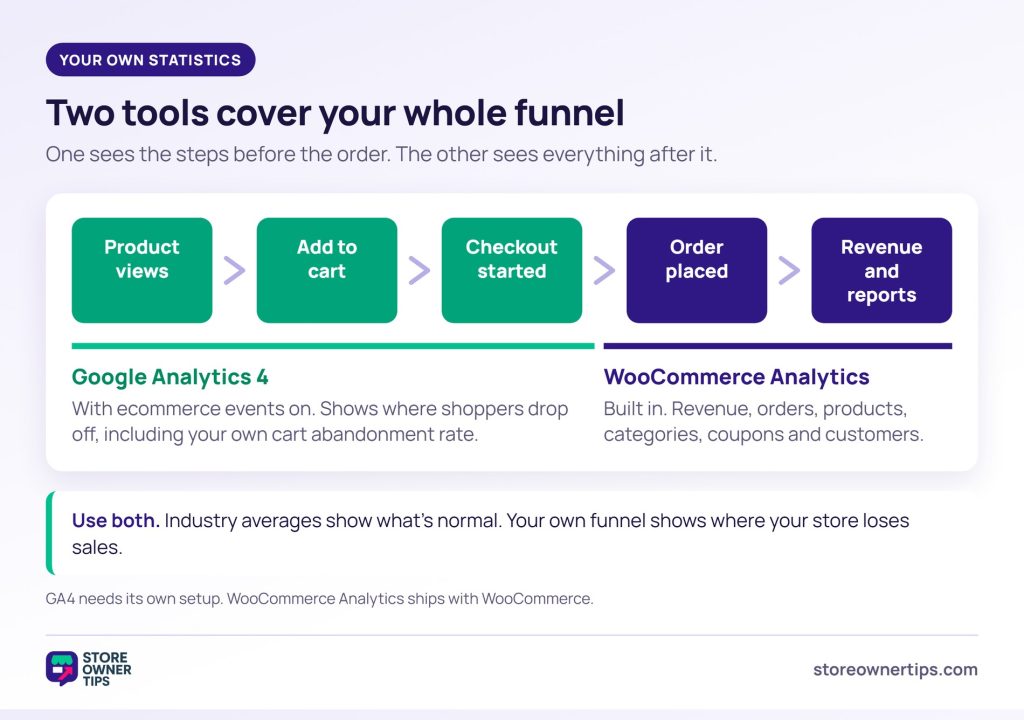
If you haven’t set that up yet, here’s how to track your own store’s numbers in Google Analytics.
Every one of these WooCommerce statistics comes from the organization that collected the data. We checked each one on its source page on November 2, 2026.
We accept three kinds of source: government statistics offices, independent research firms and WooCommerce’s own pages. The government offices are the US Census Bureau, the ONS, Eurostat and the Federal Reserve. The research firms are Baymard Institute, McKinsey and Gartner. We use WooCommerce and WordPress.org pages only for WooCommerce’s own usage numbers.
We don’t cite figures from companies that sell to store owners, such as plugin makers, hosts or other ecommerce platforms. That includes our own sister brands, so every number comes from a neutral collector. We also don’t quote tracker numbers second-hand from other roundups.
That rule is why you won’t find an “average WooCommerce conversion rate” or “average add-to-cart rate” here. We couldn’t find a primary source for either that meets the standard above. So we left them out rather than guess.
We re-check each section whenever its source publishes new data. To cite a figure, link this page and name the original source alongside it.
WooCommerce says more than 4 million online stores are built with it, citing Store Leads. Store Leads counts stores that use the WooCommerce cart or checkout. Install counts run higher because they include sites that have the plugin active but don’t sell. For example, the plugin’s WordPress.org listing shows 7+ million active installations.
WooCommerce’s product page says WordPress powers more than 82 million sites, or 43.5% of the internet. Its enterprise page rounds the same figure to 43% and credits W3Techs. Either way, WordPress runs a large share of the web.
Baymard Institute puts the average documented online cart abandonment rate at 70.22%, based on 50 studies. That list page was last updated on September 22, 2025. Your own store’s rate will differ, so check it in Google Analytics rather than assuming the average applies.

When you quote one of these WooCommerce statistics, put the source, the date and who was counted in one sentence. That way, it holds up when a reader checks it. Then compare each figure with your own data, since your own numbers are the ones you can change.
Writing about WooCommerce or ecommerce data? You’re welcome to cite this page, as long as you name the original source too. If gifting is your angle, our sister site SaveTo Wishlist has gift registry statistics built the same way.

Copyright © StoreOwnerTips.com. All Rights Reserved.
