Weekly ecommerce tips, deals & news.
Bounce rate is the percentage of visitors who land on your site and leave without engaging. In older analytics, a bounce was a single-page visit with no further action. Newer tools measure it as the share of sessions that weren’t engaged. A high bounce rate often means visitors didn’t find what they expected.
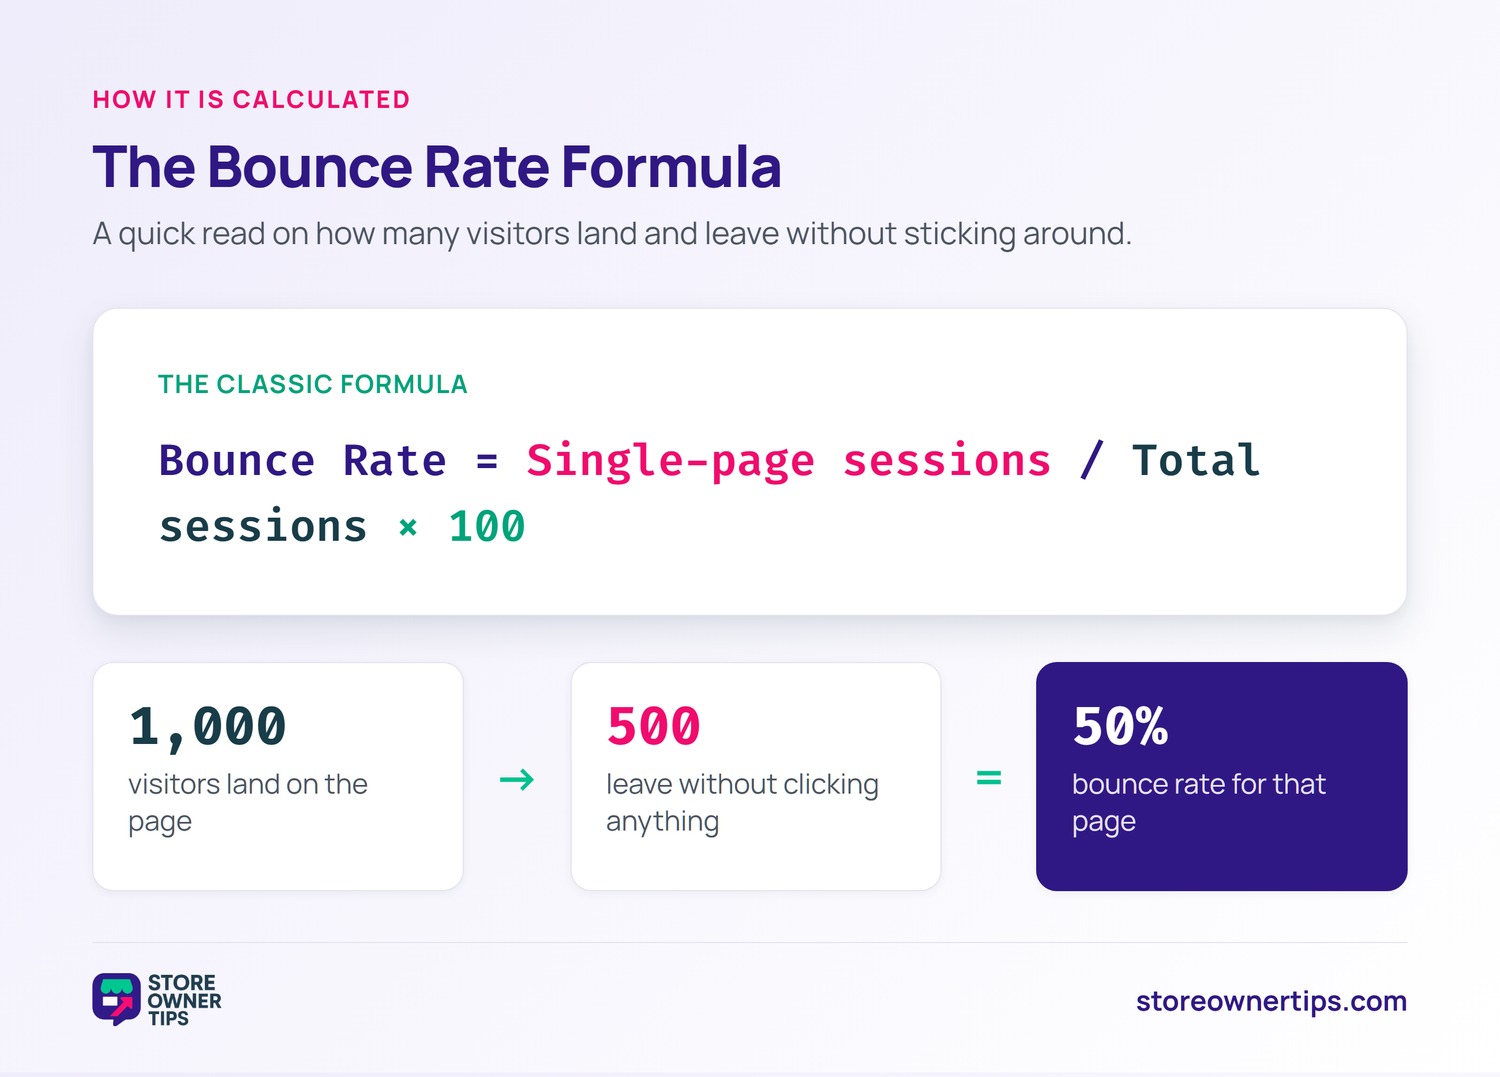
The classic formula is straightforward. Divide single-page sessions by total sessions, then multiply by 100. If 1,000 people land and 500 leave without clicking anything, that’s a 50% bounce rate. It’s a quick read on how many visitors don’t stick around.
The metric works at the page level and the site level. You can see it for one landing page or the whole store. A single bad page can drag the average up. Thus, always look at bounce rate page by page, not just overall.
Bounce rate used to mean a single-page visit, full stop. Google Analytics 4 redefined it around engagement. Now a bounce is simply a session that wasn’t engaged. An engaged session lasts over 10 seconds, has a conversion, or includes two or more page views.
In practice, bounce rate in GA4 is the inverse of engagement rate. If 70% of sessions are engaged, your bounce rate is 30%. This version is more forgiving, since a visitor who reads for 15 seconds no longer counts as a bounce. Know which definition your tool uses before you judge the number.
This shift matters for how you report. A bounce rate that looks great in GA4 may not match last year’s number. When you share the figure, note which tool and definition produced it. Otherwise the trend can mislead everyone.
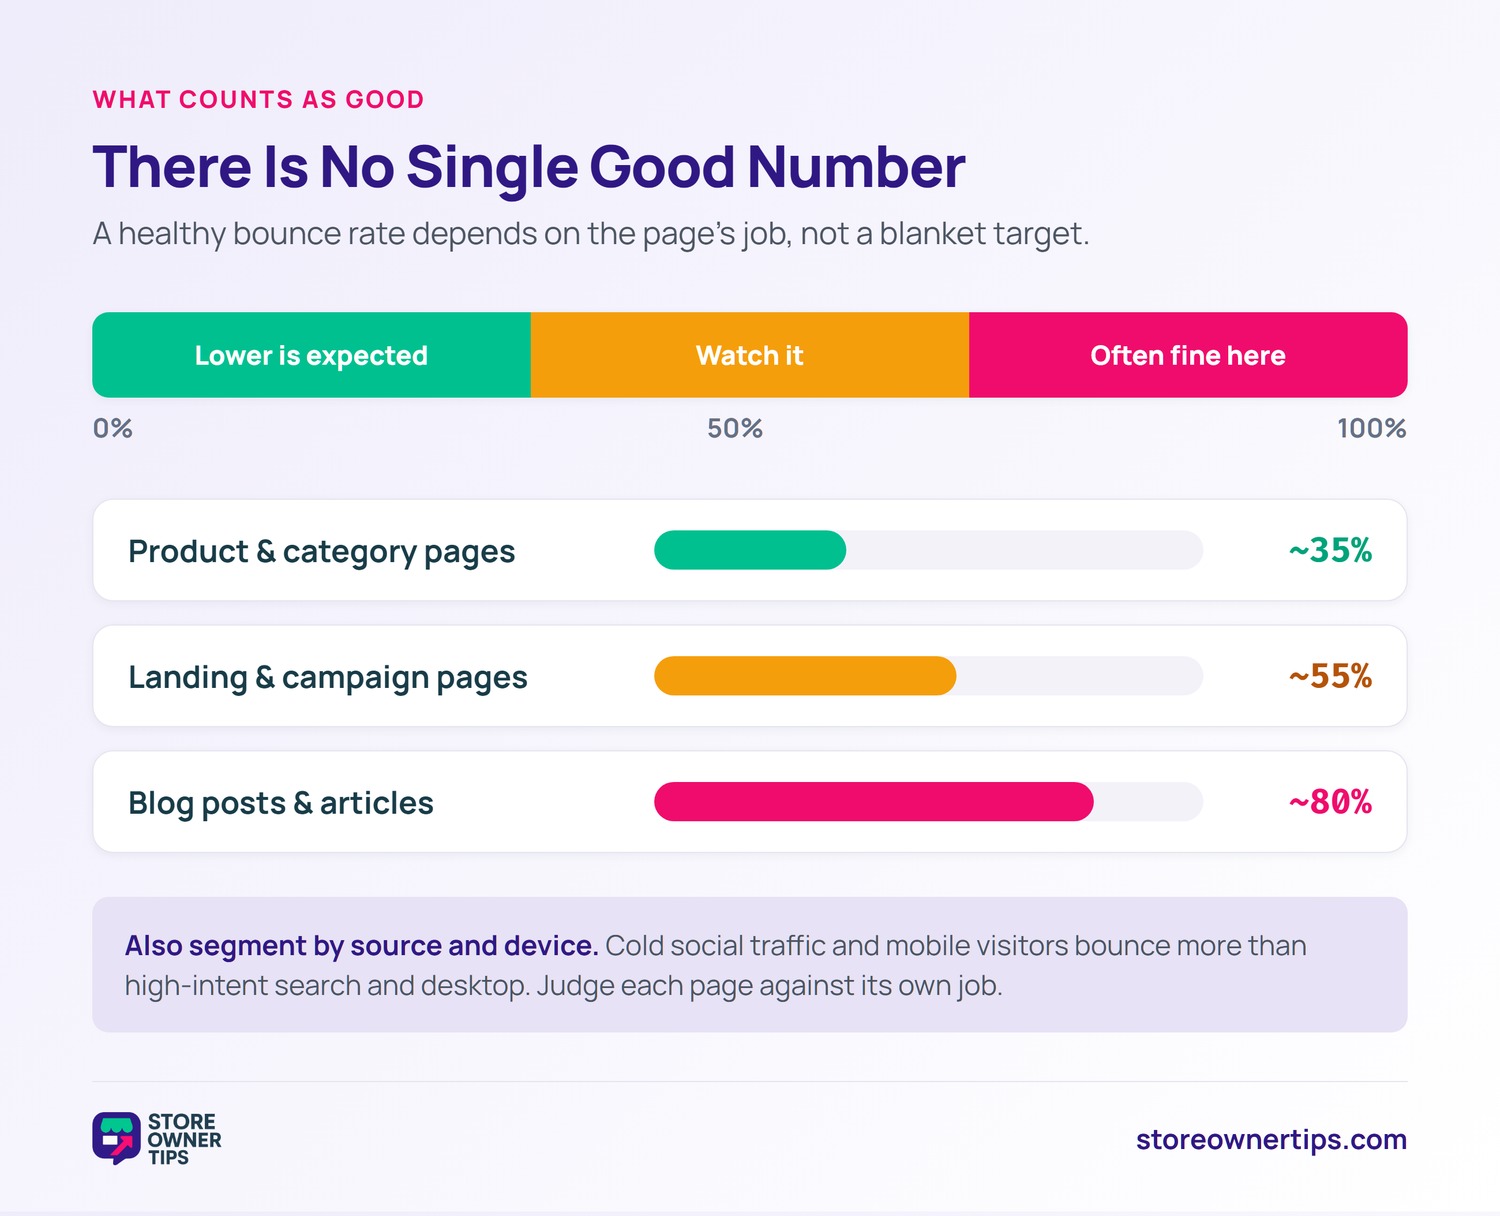
There’s no single good number, because it depends on the page. A blog post or news article often has a high bounce rate, and that’s fine. A product or category page should hold visitors longer. Judge each page against its job, not a blanket target.
Traffic source shifts it too. Cold social traffic bounces more than high-intent search traffic. So segment your bounce rate by channel. A scary-looking average often hides a few weak pages or sources.
Device matters as well. Mobile visitors often bounce more than desktop ones. Smaller screens and quick browsing raise the odds of a fast exit. A mobile-first design helps keep them around.
Speed is one of the biggest causes of bounces. Google found that 53% of mobile visits are abandoned if a page takes over three seconds to load. People simply won’t wait. Every extra second gives them a reason to leave.
The pattern gets worse as pages slow down. As load time stretches from one second to ten, the probability of a bounce rises 123%. That’s why speed is a conversion issue, not just a tech one. Faster pages keep more visitors in the door.
Google’s Core Web Vitals give you concrete targets. Largest Contentful Paint should happen within 2.5 seconds for a good experience. Hitting these benchmarks directly lowers bounces. They are a practical checklist for a faster, stickier site.
Speed isn’t the only culprit. Mismatched intent is just as common. If your ad promises one thing and the page delivers another, visitors leave fast. Aligning the page with what the visitor searched for is half the battle.
Poor design and friction do the rest. Intrusive popups, hard-to-read text, and confusing layouts all push people away. A weak mobile experience bounces your largest audience. Clear, fast, relevant pages are the fix.
Technical issues bounce people too. Broken layouts, 404 errors, and intrusive interstitials all send visitors away. Mobile glitches are especially costly. Test your key pages on a phone before you blame content.
Bounce rate is a clue, not a verdict. On its own it doesn’t tell Google how to rank you. But it points to experiences that quietly cost sales. A page everyone abandons is rarely doing its job.
It also flags wasted spend. If paid traffic bounces, you’re paying for clicks that go nowhere. Watching bounce rate by campaign shows where money leaks. Fixing those pages lifts the return on every visit.
It works best as an early warning. A sudden spike often means something broke, like a slow script or a bad redirect. Catching that fast saves traffic you already paid for. Treat a jump as a prompt to investigate, not to panic.
The first mistake is chasing a low bounce rate everywhere. Some pages are meant to answer a question and send people off. Forcing engagement there can hurt the experience.
The second is comparing across different definitions. A GA4 figure won’t match an old Universal Analytics one. Lining them up side by side leads to false alarms.
The third is ignoring segments. A healthy average can hide one terrible landing page. Always break the number down before acting on it.
Start with the basics that move the needle. Speed up your pages and pass Core Web Vitals. Match each page’s content to the intent that brought visitors there. Make the next step obvious with a clear call to action.
Then improve the experience itself. Use readable text, helpful images, and links to related content. Internal links give visitors a reason to keep clicking. Small, steady fixes usually beat one big redesign.
Test changes, don’t guess at them. Compare a page’s bounce rate before and after each fix. Keep what works and revert what doesn’t. Lowering bounce rate is a series of small, measured wins.
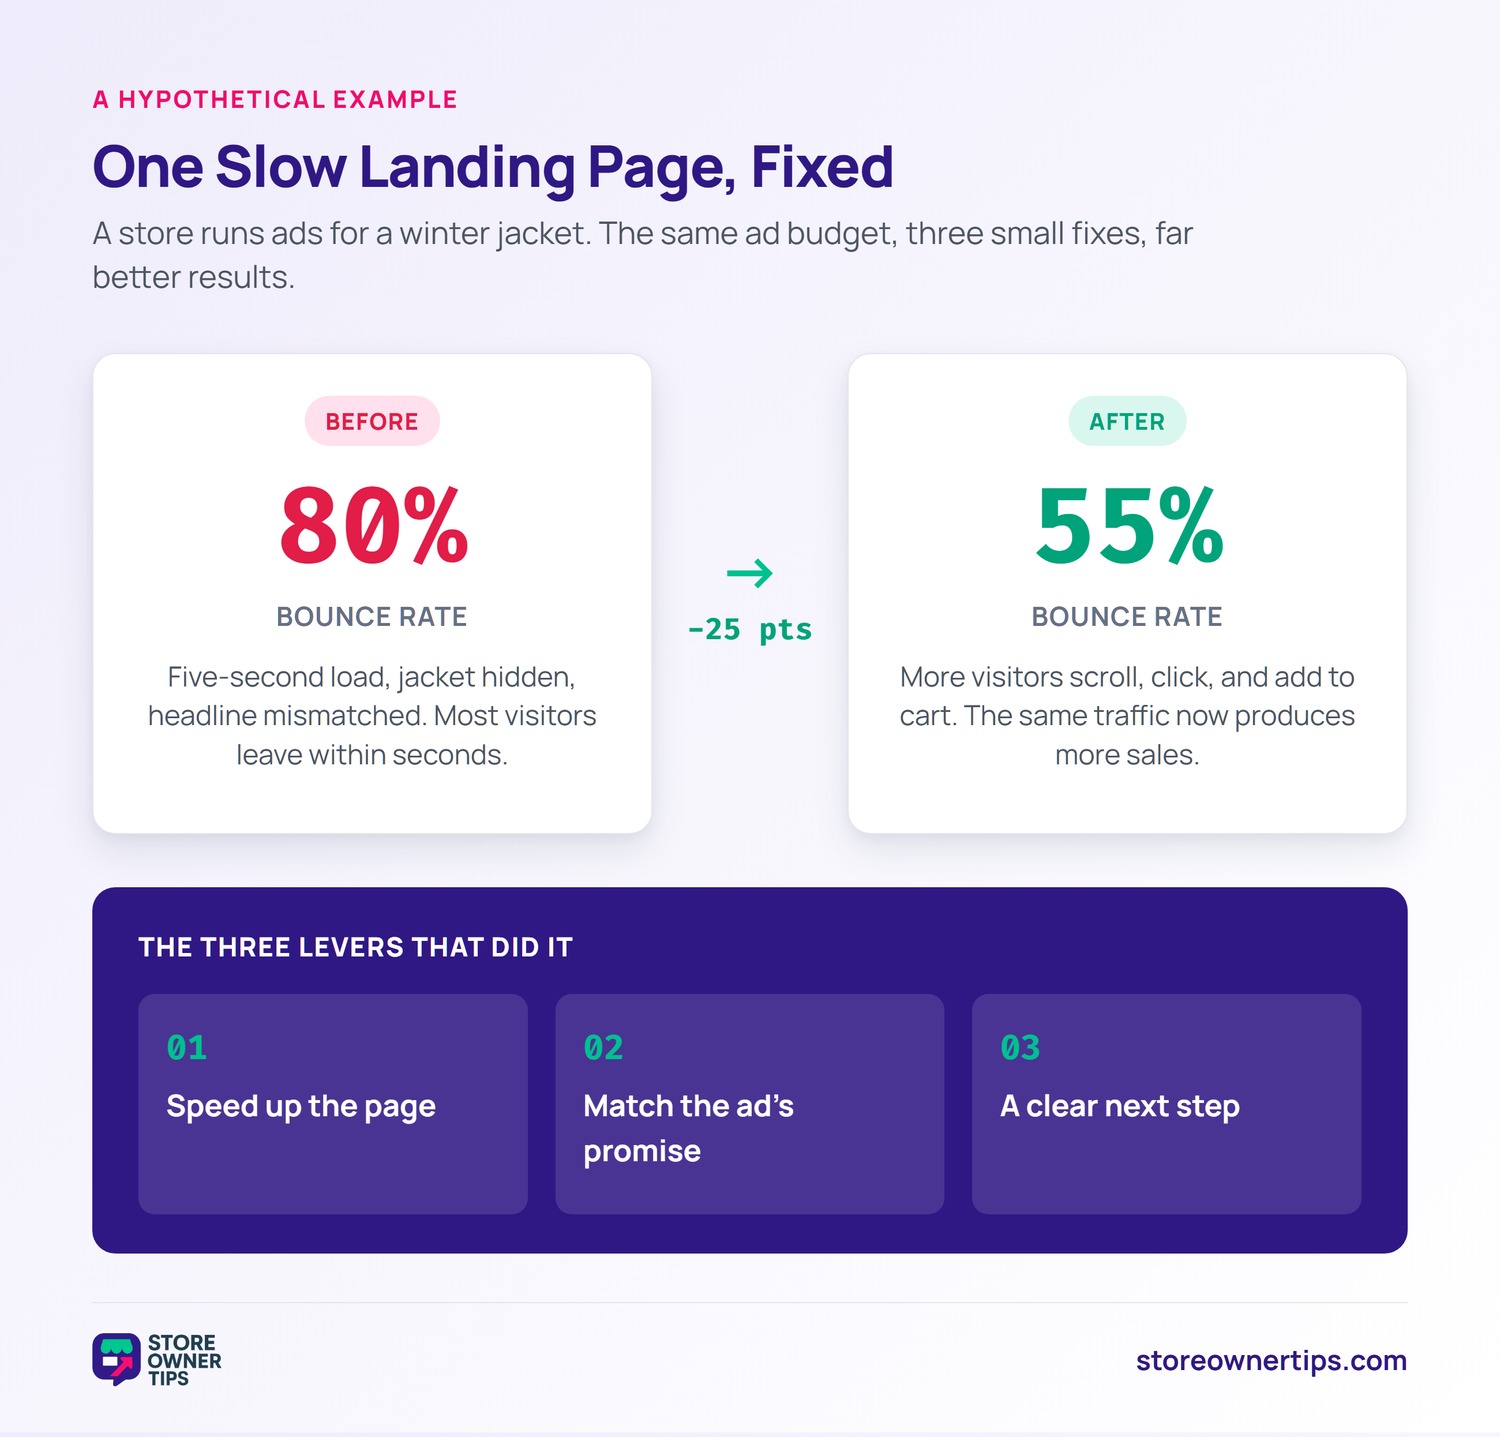
Imagine a store running ads for a winter jacket. The ad sends clicks to a slow, cluttered landing page. It takes five seconds to load, and the jacket isn’t even visible at first. Most visitors leave within seconds.
The owner checks analytics and sees an 80% bounce rate on that page. She speeds up the page and puts the jacket front and center. She also matches the headline to the ad’s promise. Visitors now find what they came for.
The bounce rate falls from 80% to 55%. More visitors scroll, click, and add to cart. The ad budget didn’t change, but it now works far harder. The same traffic produces more sales.
She didn’t stop there. She set up a simple monthly check on her top landing pages. Any page over a 70% bounce rate gets a review. The habit keeps small problems from becoming big ones.
The fix wasn’t fancy. It was speed, relevance, and a clear next step. Those three levers handle most bounce problems. The page finally does its job.
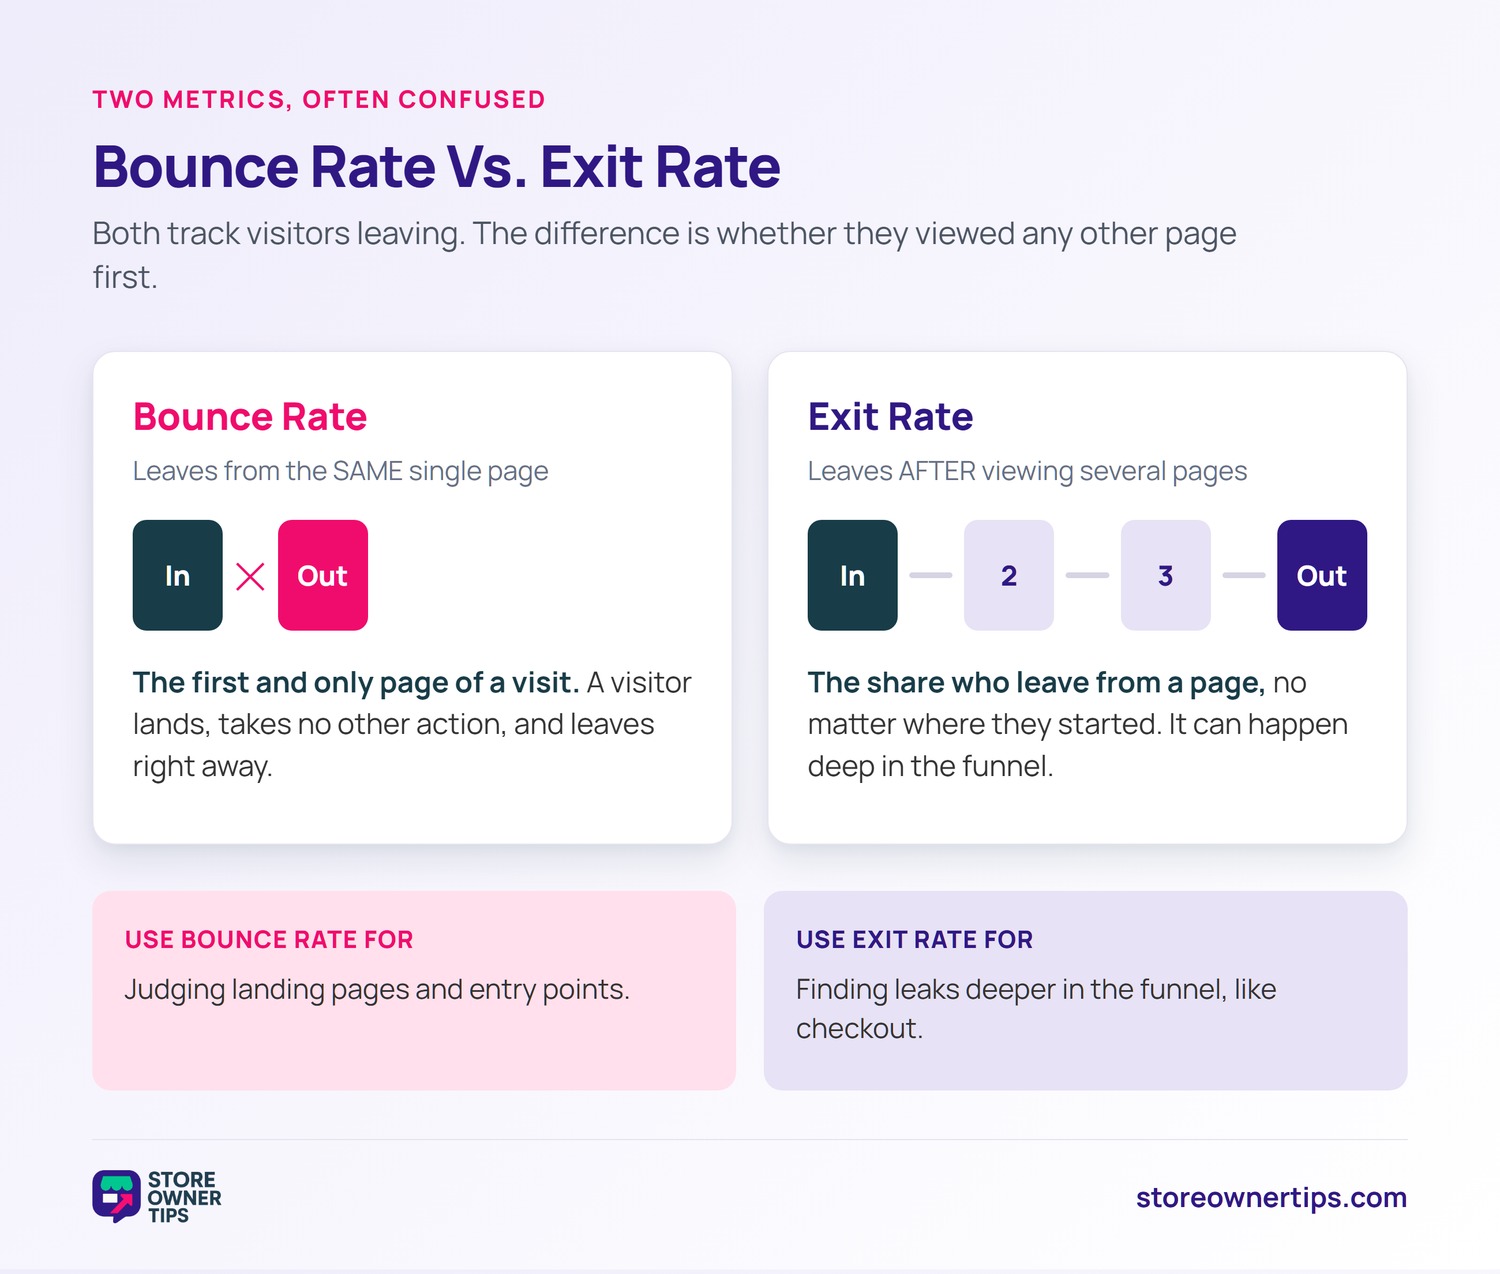
Bounce rate and exit rate get confused often. Bounce rate counts visits that leave from the same page they entered, with no other action. Exit rate counts the share of people who leave from a page, regardless of where they started.
Here’s the difference in plain terms. A bounce is always the first and only page of a visit. An exit can happen after someone browses several pages. A checkout page with a high exit rate is a red flag, while a high exit on a thank-you page is normal.
Most analytics tools report both side by side. Use bounce rate to judge landing pages and entry points. Use exit rate to find leaks deeper in the funnel. Together they show where visitors slip away.
It depends entirely on the page and traffic source. A blog post might see 70% or more and be perfectly healthy. A product page should usually hold visitors better than that. Compare each page to similar pages, not a single benchmark.
Not always. If a visitor reads your answer and leaves satisfied, that bounce isn’t a problem. However, it’s a concern when shoppers leave a page meant to drive action, like a product page. Pair bounce rate with time on page and conversions for the full story.
Focus on speed, relevance, and clarity. Make pages load fast and pass Core Web Vitals. Match content to what visitors searched for, and add clear next steps. Start with your slowest, highest-traffic pages for the biggest gain.
Bounce rate shows how many visitors leave without engaging. It’s most useful read page by page, with the page’s purpose in mind. Fix speed, match intent, and guide the next click, and you’ll keep more visitors long enough to convert.
Copyright © StoreOwnerTips.com. All Rights Reserved.
