Weekly ecommerce tips, deals & news.
Redemption rate is the share of issued coupons that shoppers actually use. Divide the number redeemed by the number distributed, then multiply by 100. It is the single clearest measure of whether a discount offer landed with the people you sent it to.
So a low rate is rarely about the discount size. It is usually about relevance or visibility.
Most stores judge a promotion by the revenue it produced. That tells you what happened, but not why. Redemption rate is the diagnostic underneath it.
It answers a narrower question. Of the people who could have used this offer, how many did?
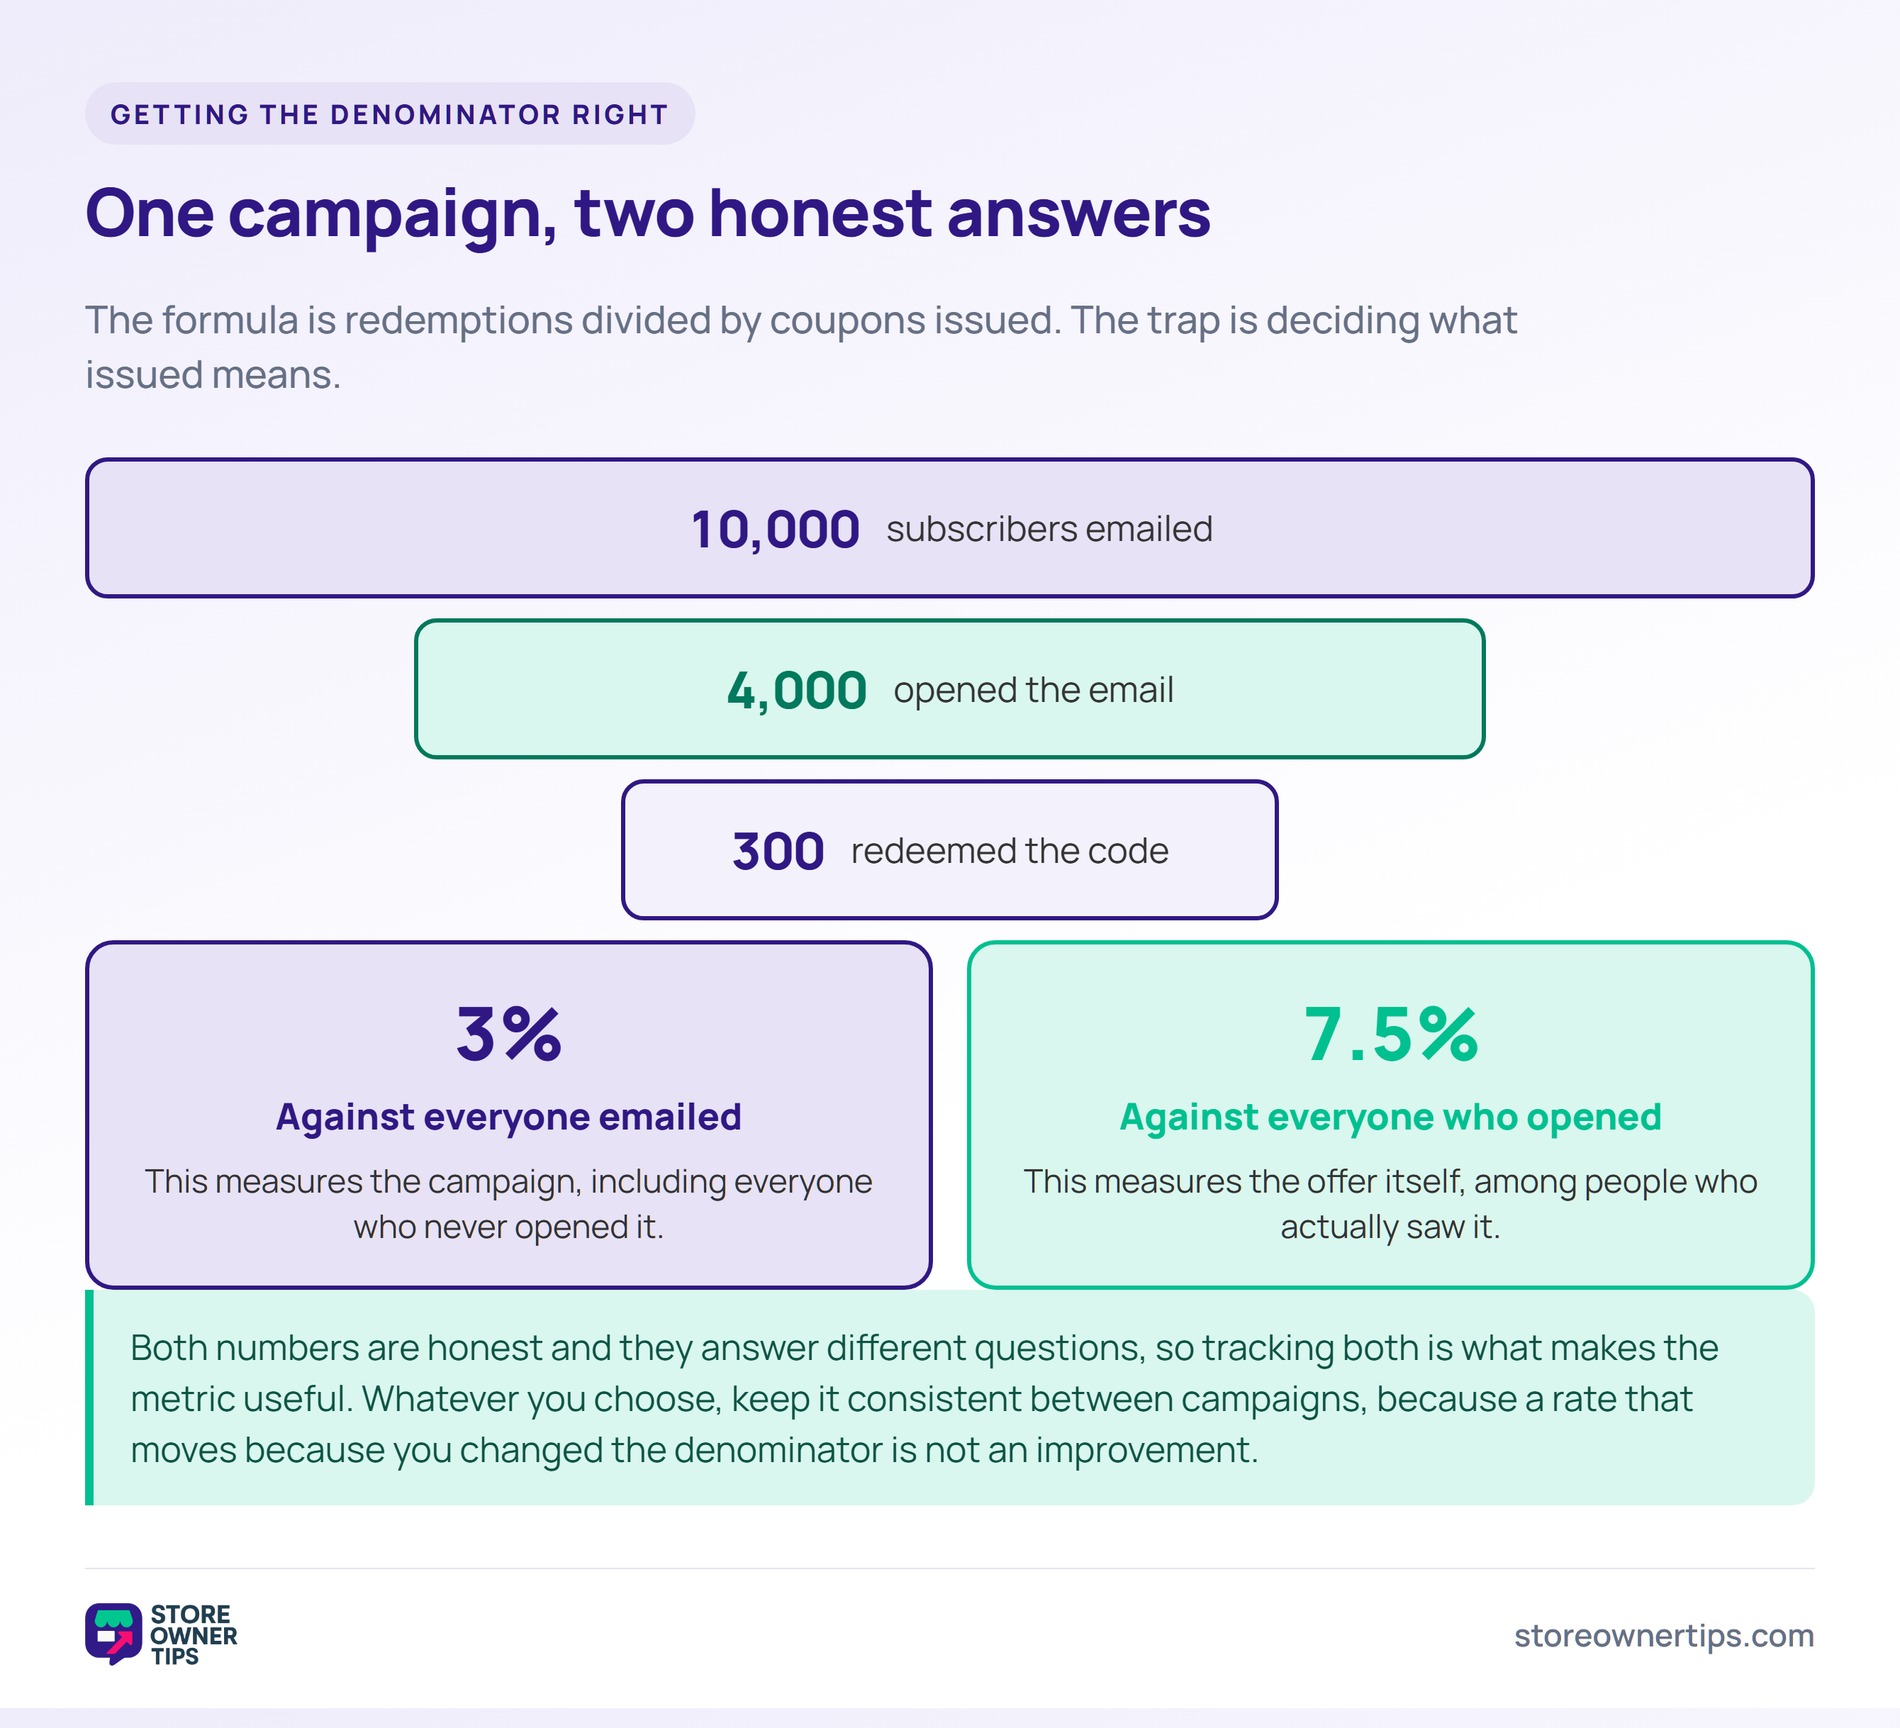
The formula is redemptions divided by coupons issued. The trap is deciding what “issued” means. So the same campaign can produce wildly different rates depending on the choice.
Take a code emailed to 10,000 subscribers with 300 redemptions. Against everyone emailed, that is 3%. Against the 4,000 who opened the email, it is 7.5%.
Both numbers are honest and they answer different questions. The first measures the campaign, while the second measures the offer itself. In practice, tracking both is what makes the metric useful.
Whatever you choose, keep it consistent between campaigns. A rate that moves because you changed the denominator is not an improvement. Meanwhile, comparing a public code to a private one is rarely meaningful at all.
Relevance moves it more than discount depth. A twenty percent code on something a shopper does not want is worth nothing. Meanwhile, a modest offer on the exact item they were considering converts easily.
That is why email segmentation tends to lift redemption more than a bigger number does. Sending a smaller offer to the right list beats a generous one sent to everybody. So the fix for a weak rate is usually the audience.
Friction is the second lever. A code that must be typed at checkout loses people who never reach that box. By contrast, a link that applies the discount automatically removes the step entirely.
Timing matters as much as either. An offer arriving days after someone abandoned a cart is competing with a decision already made. In practice, a cart abandonment discount sent within hours performs very differently from one sent next week.
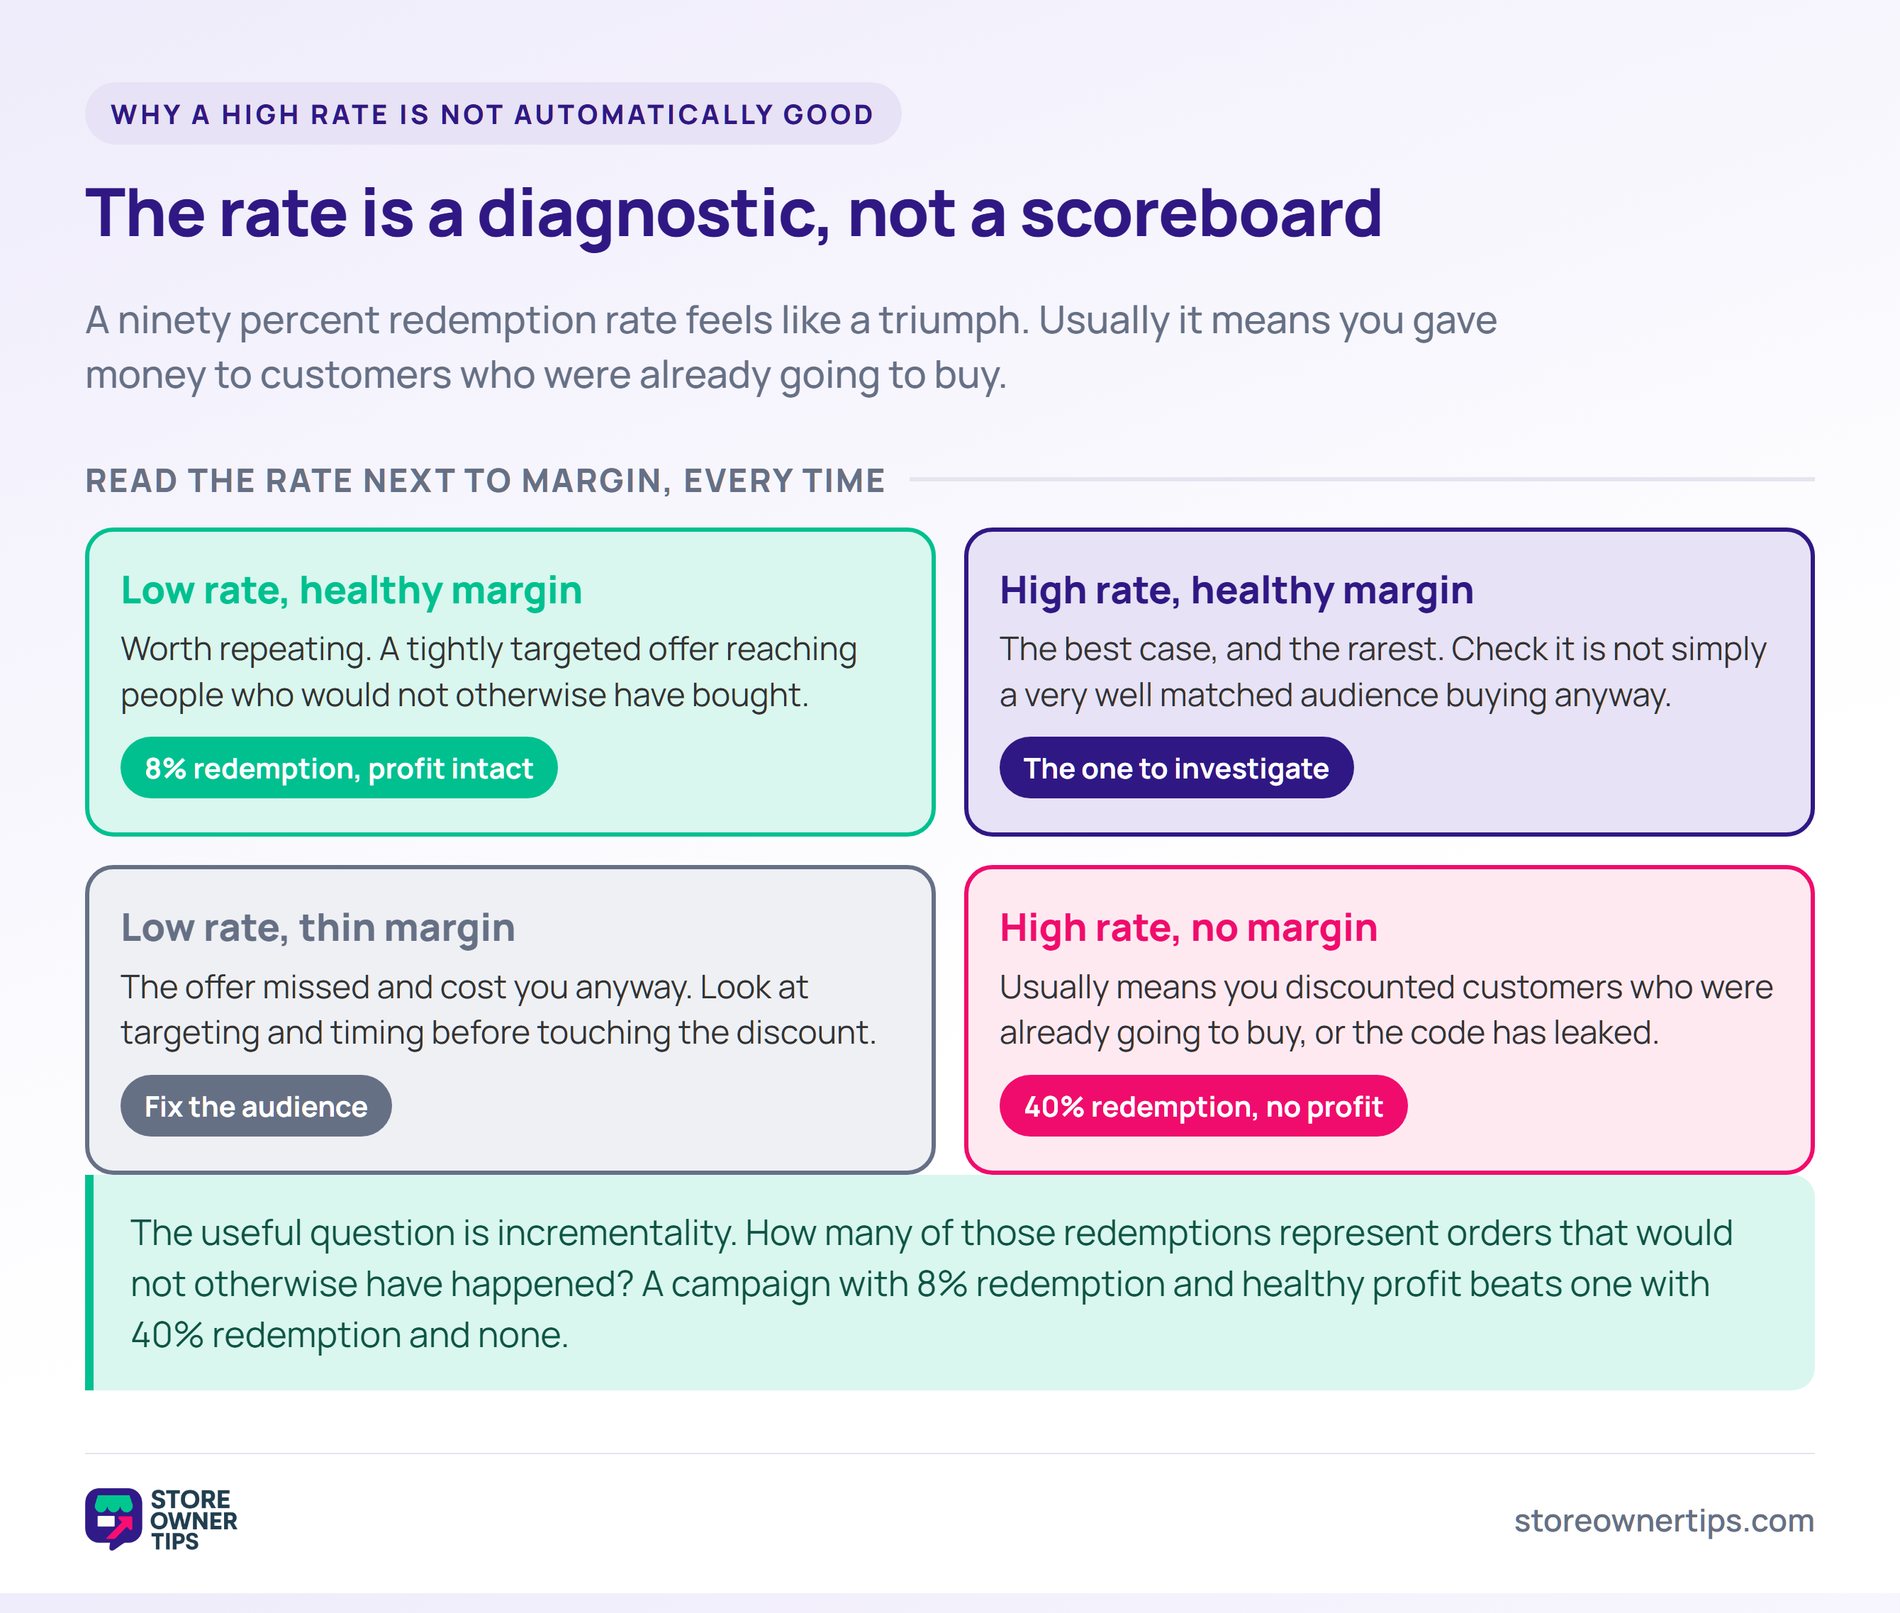
This is the part that catches people out. A ninety percent redemption rate feels like a triumph. However, it usually means you gave money to customers who were already going to buy.
The useful question is incrementality. How many of those redemptions represent orders that would not otherwise have happened? So a lower rate on genuinely new customers can be worth far more.
Very high rates also hint at leakage. A private code redeemed far more often than the list size allows has escaped somewhere. Meanwhile, that is a sign of discount code distribution you no longer control.
So read redemption next to margin every time. A campaign with 8% redemption and healthy profit beats one with 40% redemption and none. In short, the rate is a diagnostic, not a scoreboard.
There is no universal benchmark, and anyone offering one is guessing. Rates swing enormously with audience, channel and offer type. So your own history is the only fair comparison.
Published figures vary hugely by context. One peer-reviewed study of coupon redemption among a national sample found that 17.6% of the 1,146 participants had redeemed one. That was a specific population, so treat it as illustration rather than a target.
The pattern most stores see is directional. Tightly targeted codes redeem far better than broadcast ones. Meanwhile, automatic offers outperform anything requiring manual entry.
So build your own baseline over several campaigns. After five or six you will know what normal looks like for your store. Then a dip becomes a signal rather than a worry.
Redemption rate is one link in a chain, and the chain is where the diagnosis lives. Before redemption come delivery and attention. So a collapsed open rate means redemption was never going to recover.
A healthy open rate with poor redemption points somewhere else. Click-through rate sits between the two. Meanwhile, a shopper who opened but never clicked did not reject your discount, they never really saw it.
After redemption comes value. Track average order value on discounted orders against normal ones. So you can tell whether the offer grew baskets or simply cheapened them.
Where you are paying for the traffic, ROAS completes the picture. A code redeeming well on paid clicks can still lose money once customer acquisition cost is counted. In practice, that is the combination worth watching most closely.
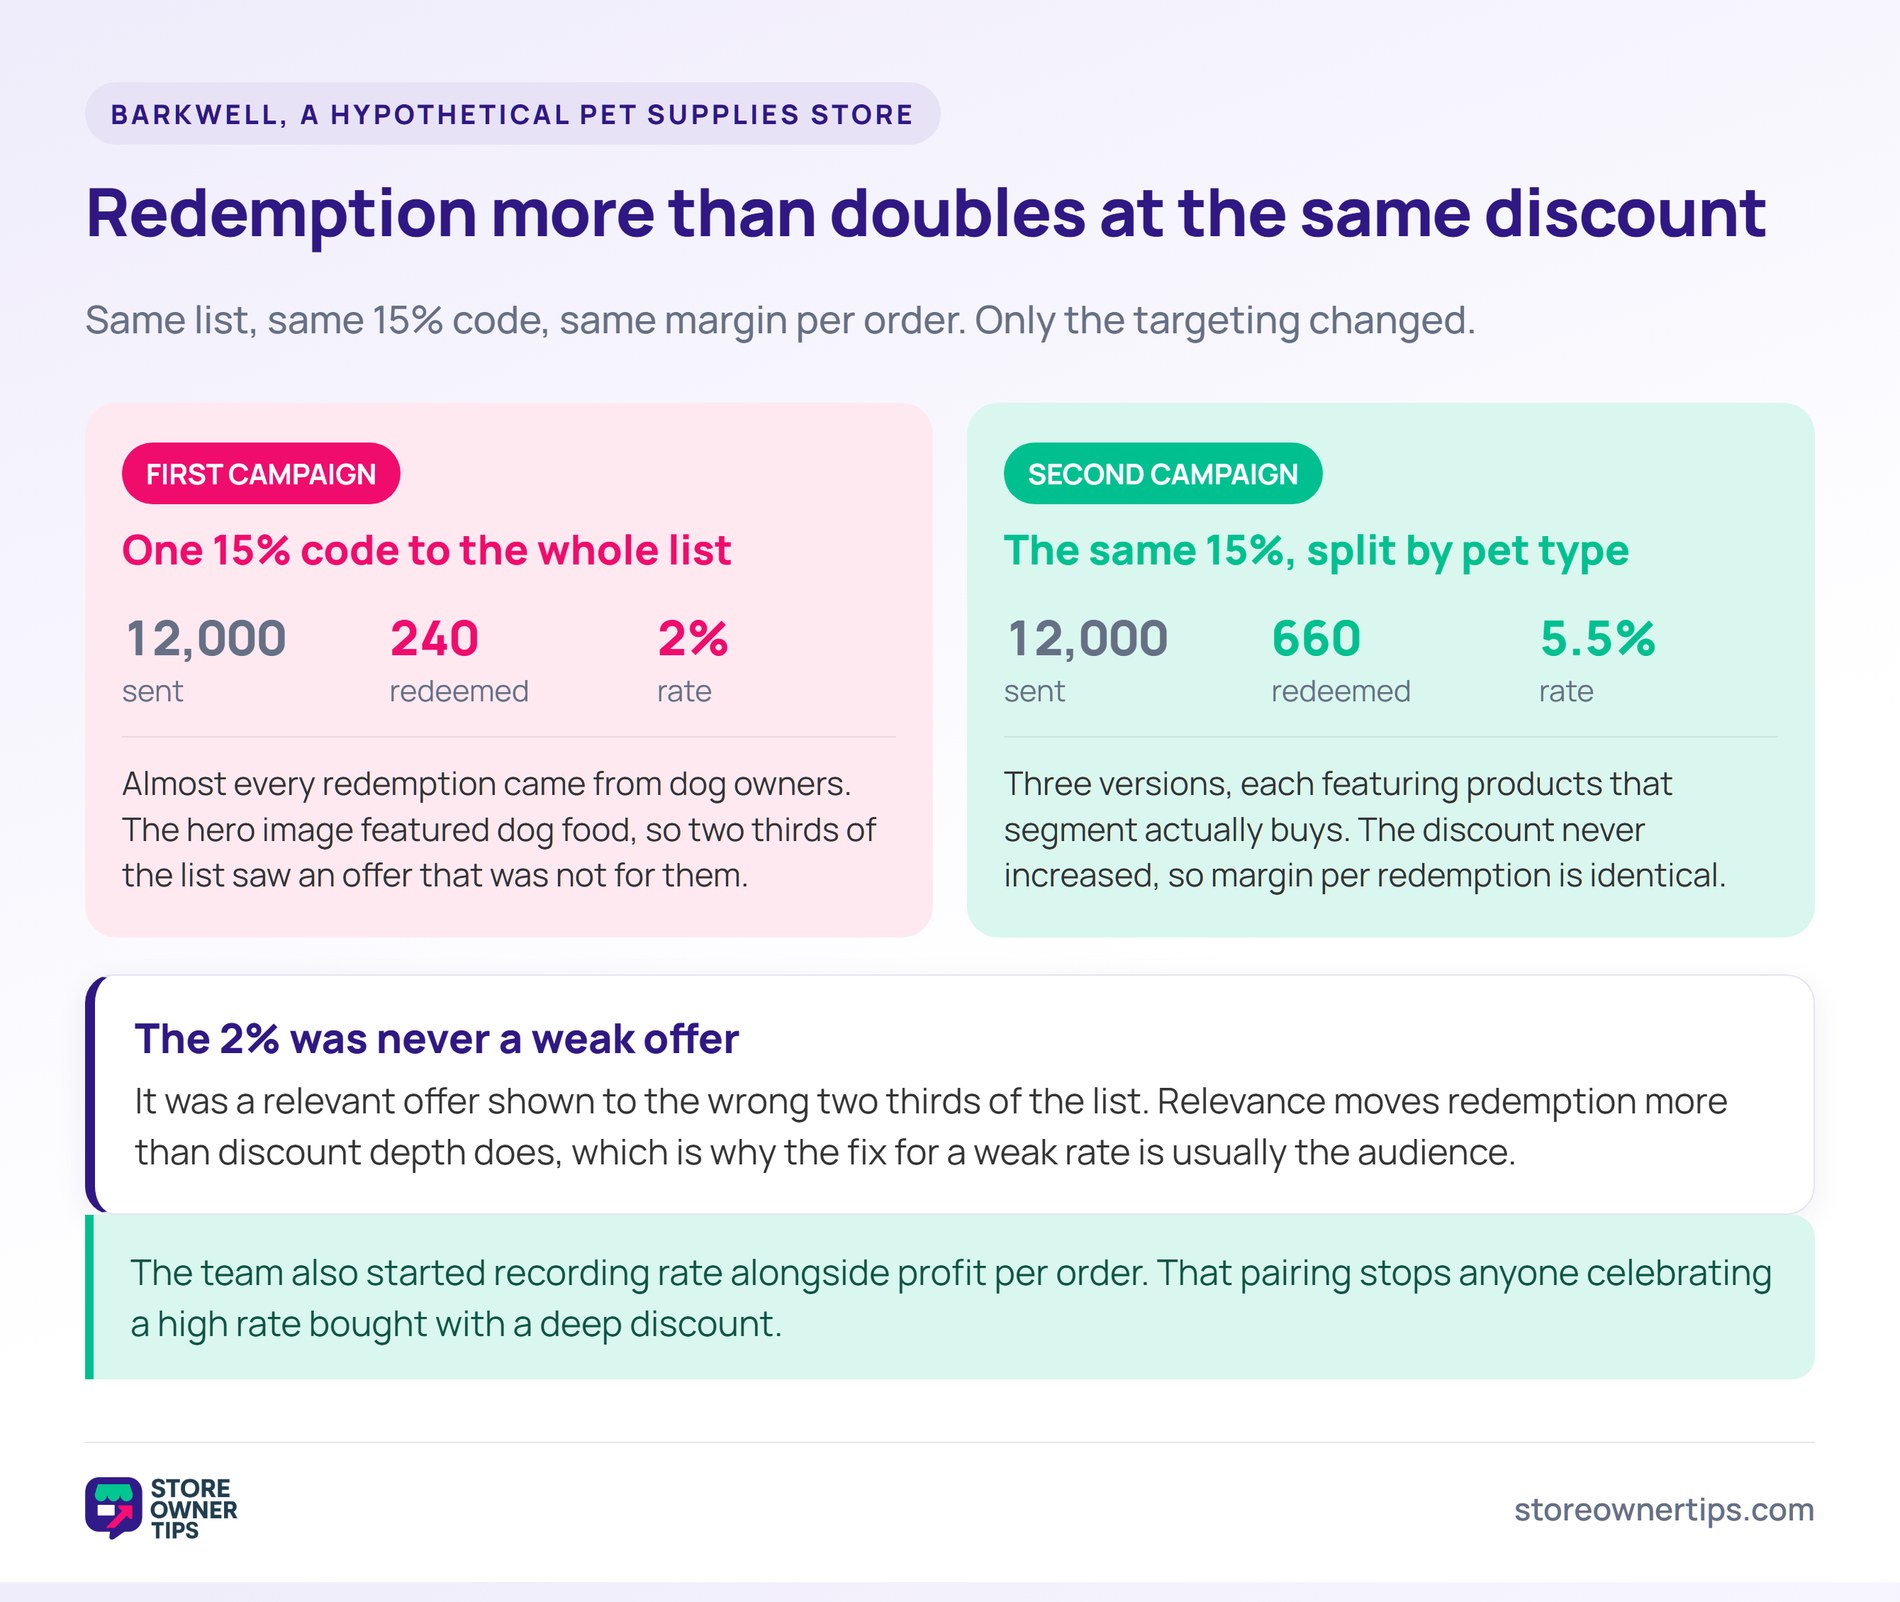
Imagine a pet supplies store called Barkwell running a spring promotion. It emails a 15% code to its full list of 12,000 subscribers. Previously it judged promotions purely on total revenue.
The code is redeemed 240 times. Against 12,000 subscribers that is a 2% redemption rate. Revenue looks acceptable, so nobody investigates further.
Digging in changes the picture. Most redemptions came from dog owners, and almost none from the cat and small-animal segments. Meanwhile, the offer had featured dog food in the hero image.
So the 2% was not a weak offer. It was a relevant offer shown to the wrong two-thirds of the list.
Barkwell splits the list by pet type and sends three versions. Each one features products that segment actually buys. Crucially, the discount stays at 15% rather than increasing.
Redemptions rise to 660 across the same 12,000 people. That is a 5.5% rate, achieved without spending an extra cent per order. So the margin per redemption is identical to before.
The team also starts recording rate alongside profit per order. That pairing stops anyone celebrating a high rate bought with a deep discount. In practice, it turns the metric into a decision tool.
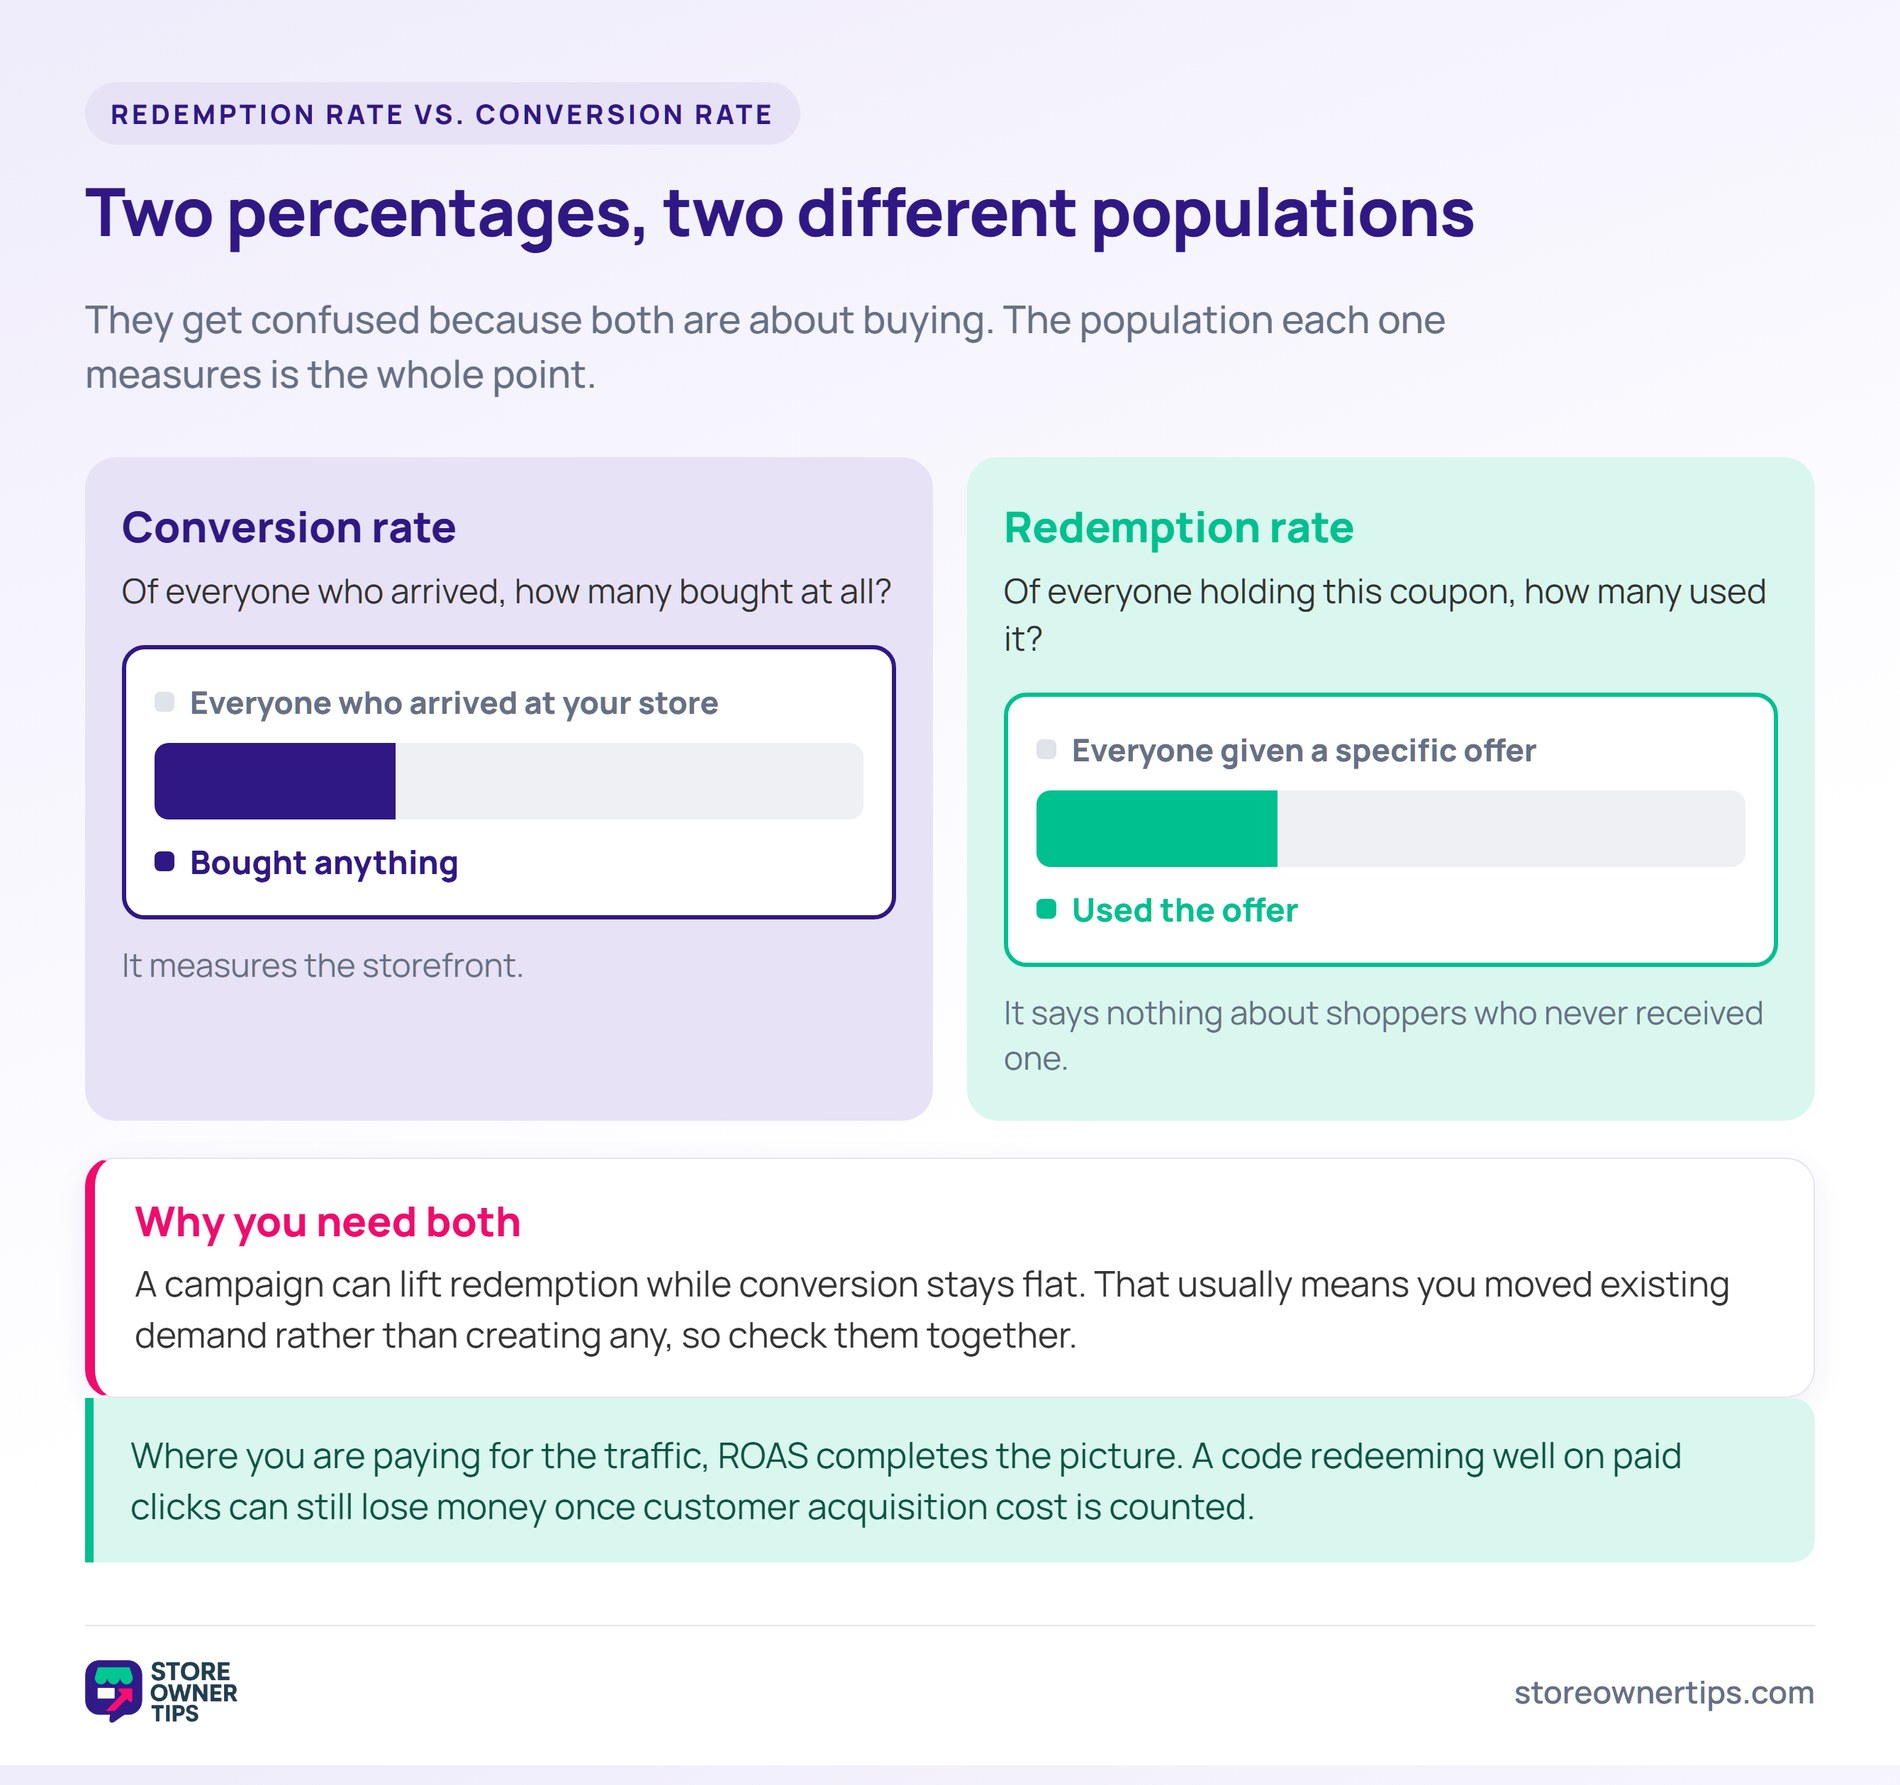
These two get confused because both are percentages about buying. They measure different populations, though. That difference is the whole point.
Conversion rate looks at visitors. Of everyone who arrived at your store, how many bought anything at all? So it measures the storefront.
Redemption rate looks at coupon holders. Of everyone given a specific offer, how many used it? Meanwhile, it says nothing about shoppers who never received one.
You need both to read a promotion properly. A campaign can lift redemption while conversion stays flat, which usually means you moved existing demand rather than creating any. So check them together.
Divide the number of times a coupon was used by the number issued, then multiply by 100. A code redeemed 300 times from 10,000 sends is 3%. The arithmetic is the easy part.
Deciding the denominator is where judgment comes in. Measuring against everyone sent tells you about the campaign. Meanwhile, measuring against openers tells you about the offer.
Usually not, and that is the most common wrong move. A bigger discount on an irrelevant product still gets ignored. So look at targeting and timing before touching the number.
Check the mechanics too. Codes that must be typed lose people, and offers that arrive late compete with a decision already made. In practice, removing friction beats deepening the discount.
No, and assuming so is how stores discount themselves into trouble. Every redemption costs margin, so a higher rate on the wrong audience simply costs more. Meanwhile, revenue can rise while profit falls.
Track profit per order beside the rate. If redemptions climb and profit per order slides, the campaign is buying activity rather than growth. So treat that combination as a warning.
Redemption rate tells you whether an offer reached the right people, which is a question revenue totals cannot answer. Keep the denominator consistent and always read the rate beside margin.
Then fix weak rates with targeting and timing rather than deeper discounts. For practical tactics, see this guide to improving coupon redemption rates.
Copyright © StoreOwnerTips.com. All Rights Reserved.
